
Undo the string. Open the flaps.
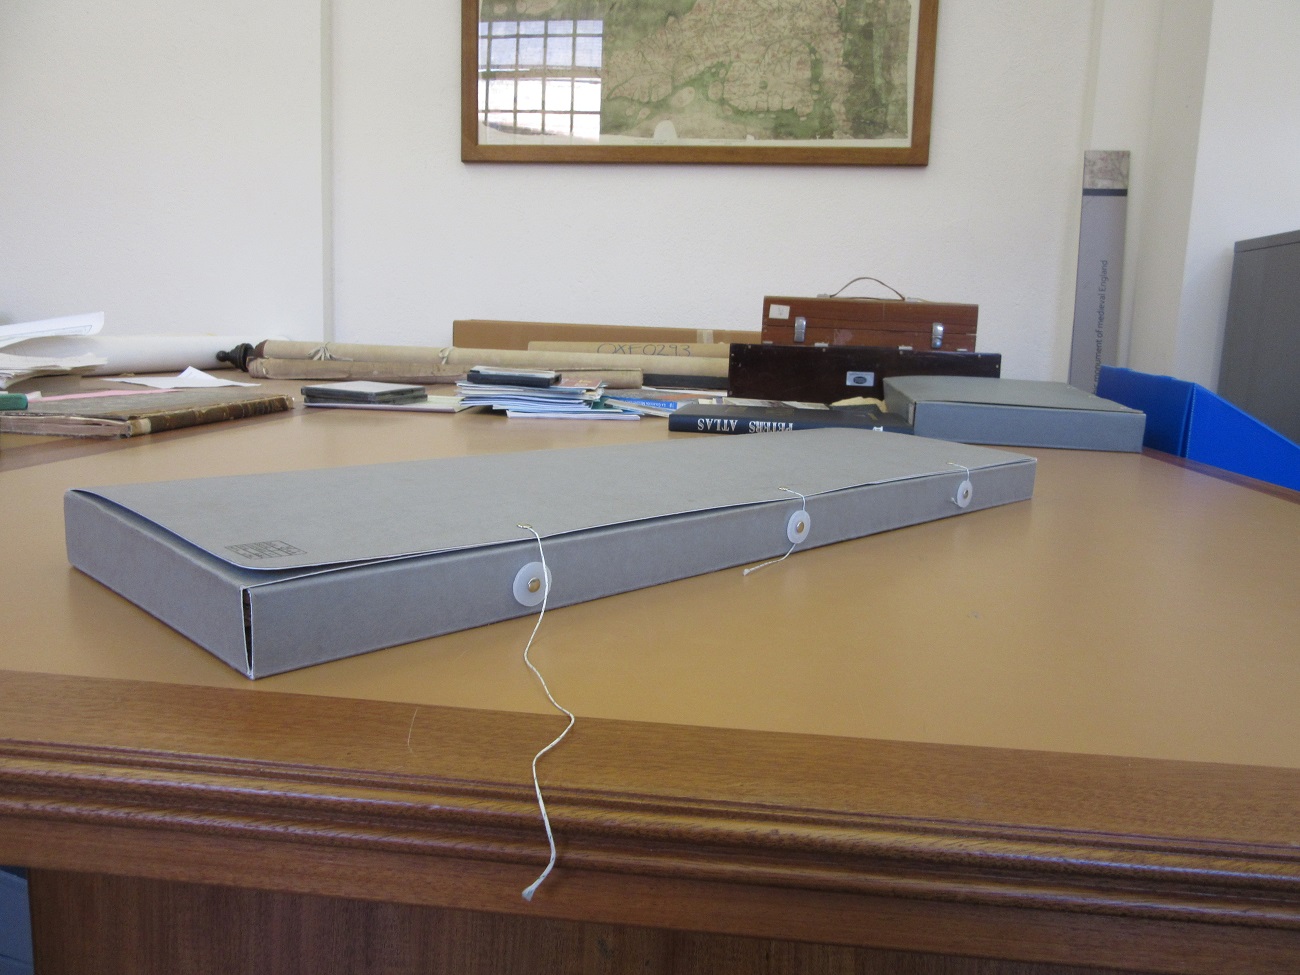

Open the wooden boards…

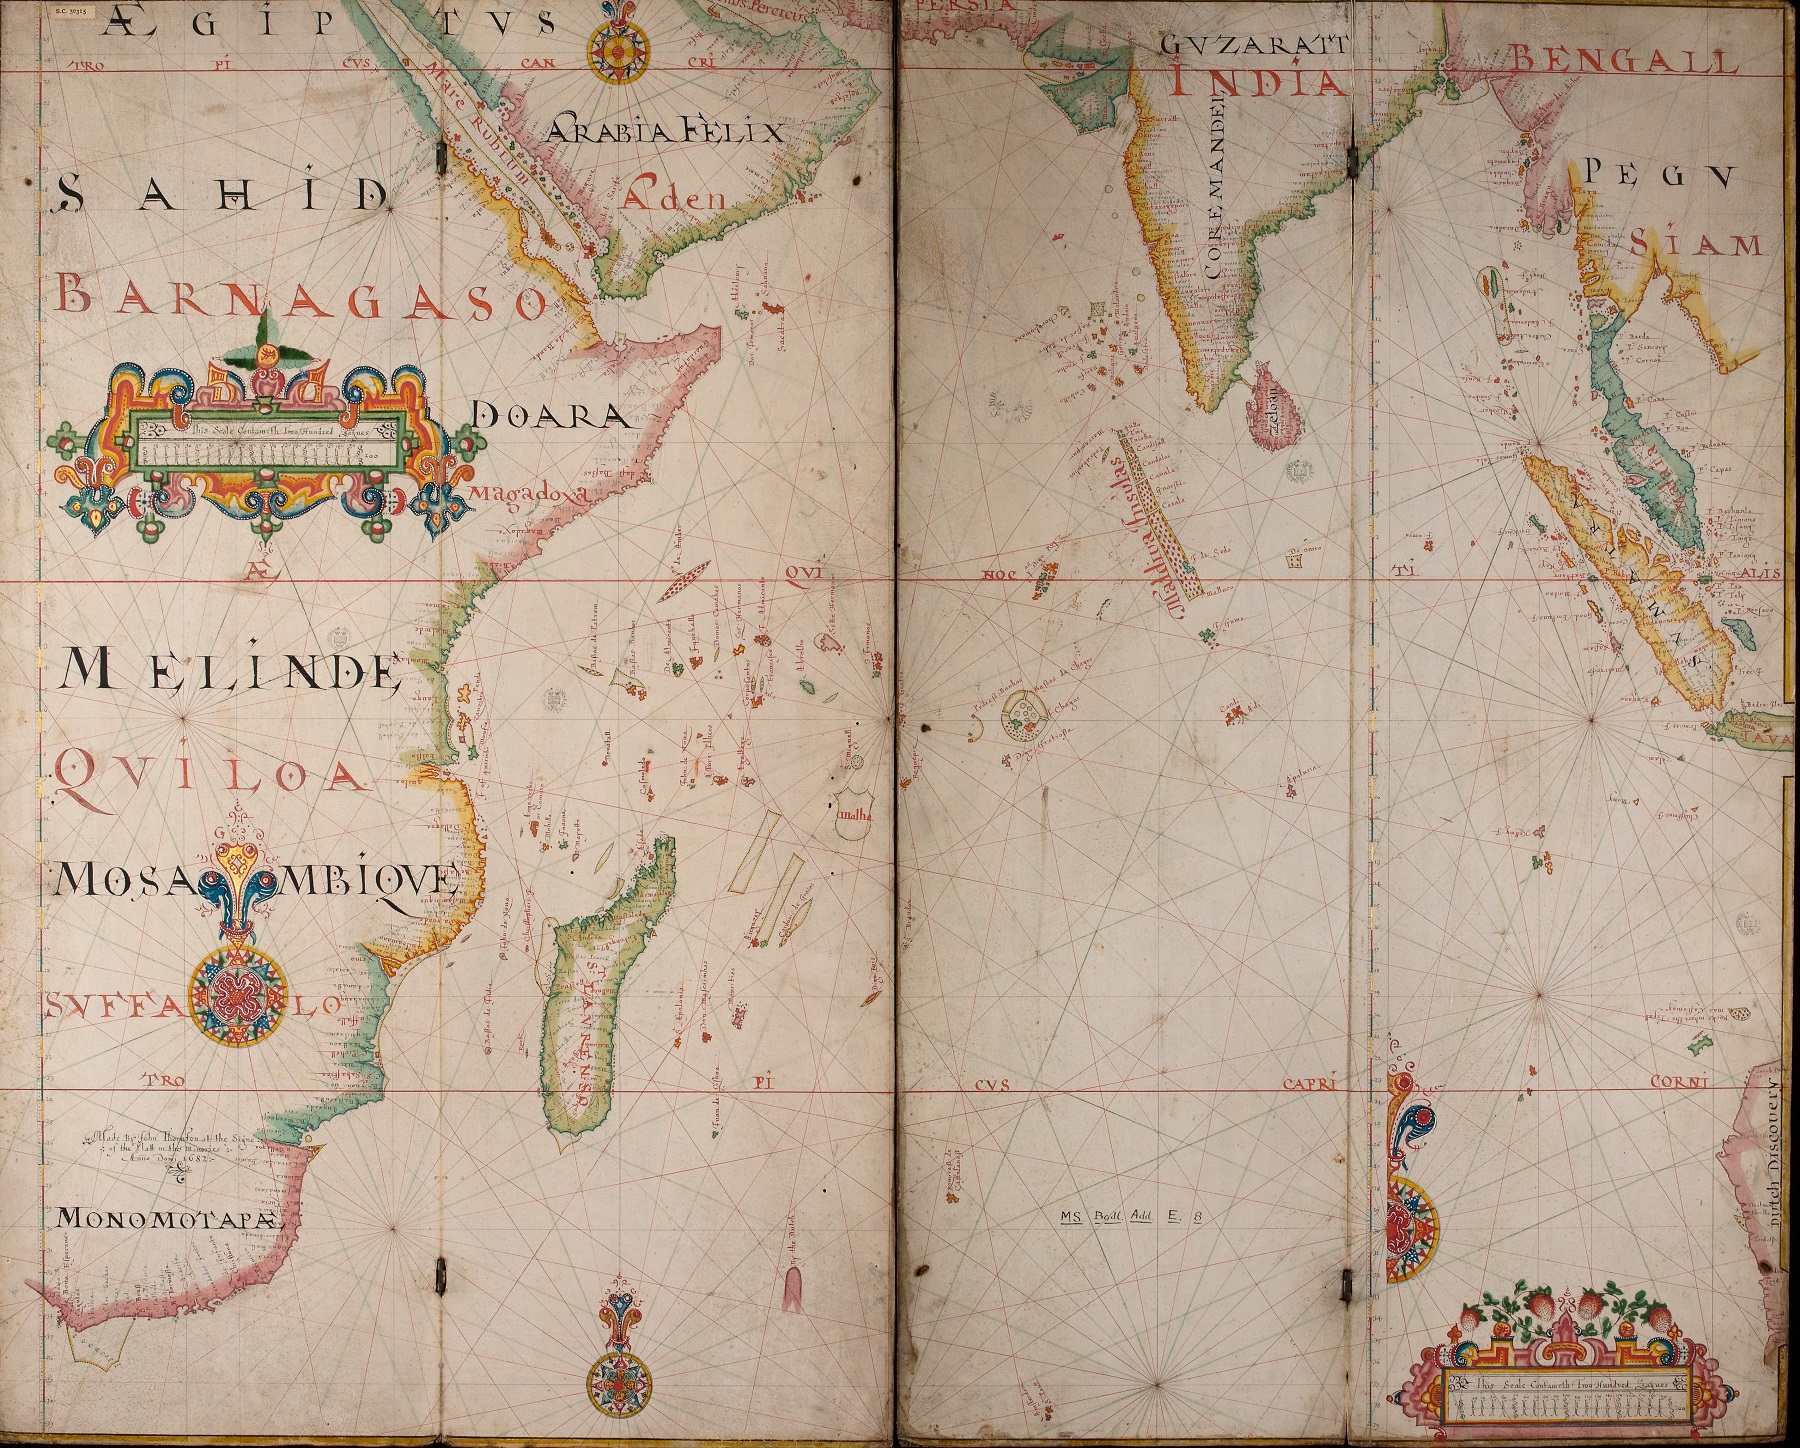
…to reveal one of the most beautifully decorated maps in the Bodleian.
Made in 1682 by John Thornton this is a late example of a Portolan Chart, a navigational map hand-drawn on vellum. By the mid-1600s printed charts were beginning to replace manuscripts such as this, in fact Thornton, in his role as Hydrographer to both the East India Company and Hudson Bay Company, regularly prepared charts for printing at the same time as creating individual works. Thornton was a member of the Thames School of cartographers, based near the London docks. The mounting of the chart on wooden boards folded concertina style is typical of the Thames School.
While many names on this chart are unfamiliar to us now the accuracy of depiction makes the area covered immediately apparent. From the east coast of Africa to the Islands of Indonesia the chart takes in the whole of the Indian Ocean, including many of the islands crucial for the navigation and re-supply across the wide ocean. The newly discovered west coast of an as yet un-named Australia appears, labelled ‘Dutch Discovery’.

 There are many wonderful things to discover on the map. Names of ports and cities are written, where possible, inland to keep the sea areas of the map as clear as possible for navigation and
to keep the chart as tidy as possible all names start from the coast. This explains why some of the names are vertical or even upside-down, a practice that dates back to the as the 1400s, the cartographer would have started from the north-western corner of the chart naming as he went along and turning the chart as he ventured around the coastline. Important cities and ports are in red. Beautiful compass roses are shown for decoration and navigation with rhumb lines radiating out across the chart, used to work out a ships course and gold-leaf is used in a number of locations.
The chart dates from a time of Dutch influence on the seas. The Dutch East India Company had control of the Spice Islands, bringing in a revenue that not only transformed the Dutch ports such as Amsterdam into rich and well-ordered cities but helped create, and then made the best use of, some of the finest maps and mapmakers of the time.

It’s not the first time that portolans and navigational charts have featured on the map blog, mainly because you rarely see one which isn’t attractive in some way. From the richly decorated but over-crowded Douce (http://blogs.bodleian.ox.ac.uk/maps/2016/06/) to the beautiful early Venetian charts (http://blogs.bodleian.ox.ac.uk/maps/2015/09/) to an early printed example dedicated to Samuel Pepys (http://blogs.bodleian.ox.ac.uk/maps/2016/06/) it is immediately apparent how different each one is to the other.
This is one of the maps featured in Treasures from the Map Room: a journey through the Bodleian collections. Oxford: Bodleian Library, 2016. ISBN 978 1 85124 250 4. Available from the Bodleian bookshop.
Untitled Portolan Chart by John Thornton, in 1682. Map Res 117.