Monthly Archives: March 2018

Descriptive sandbanks

We are used to seeing maps a certain way; the land in detail with physical features described or shown and generally with north at the top.  On my desk today is a map which turns all that on its head. 
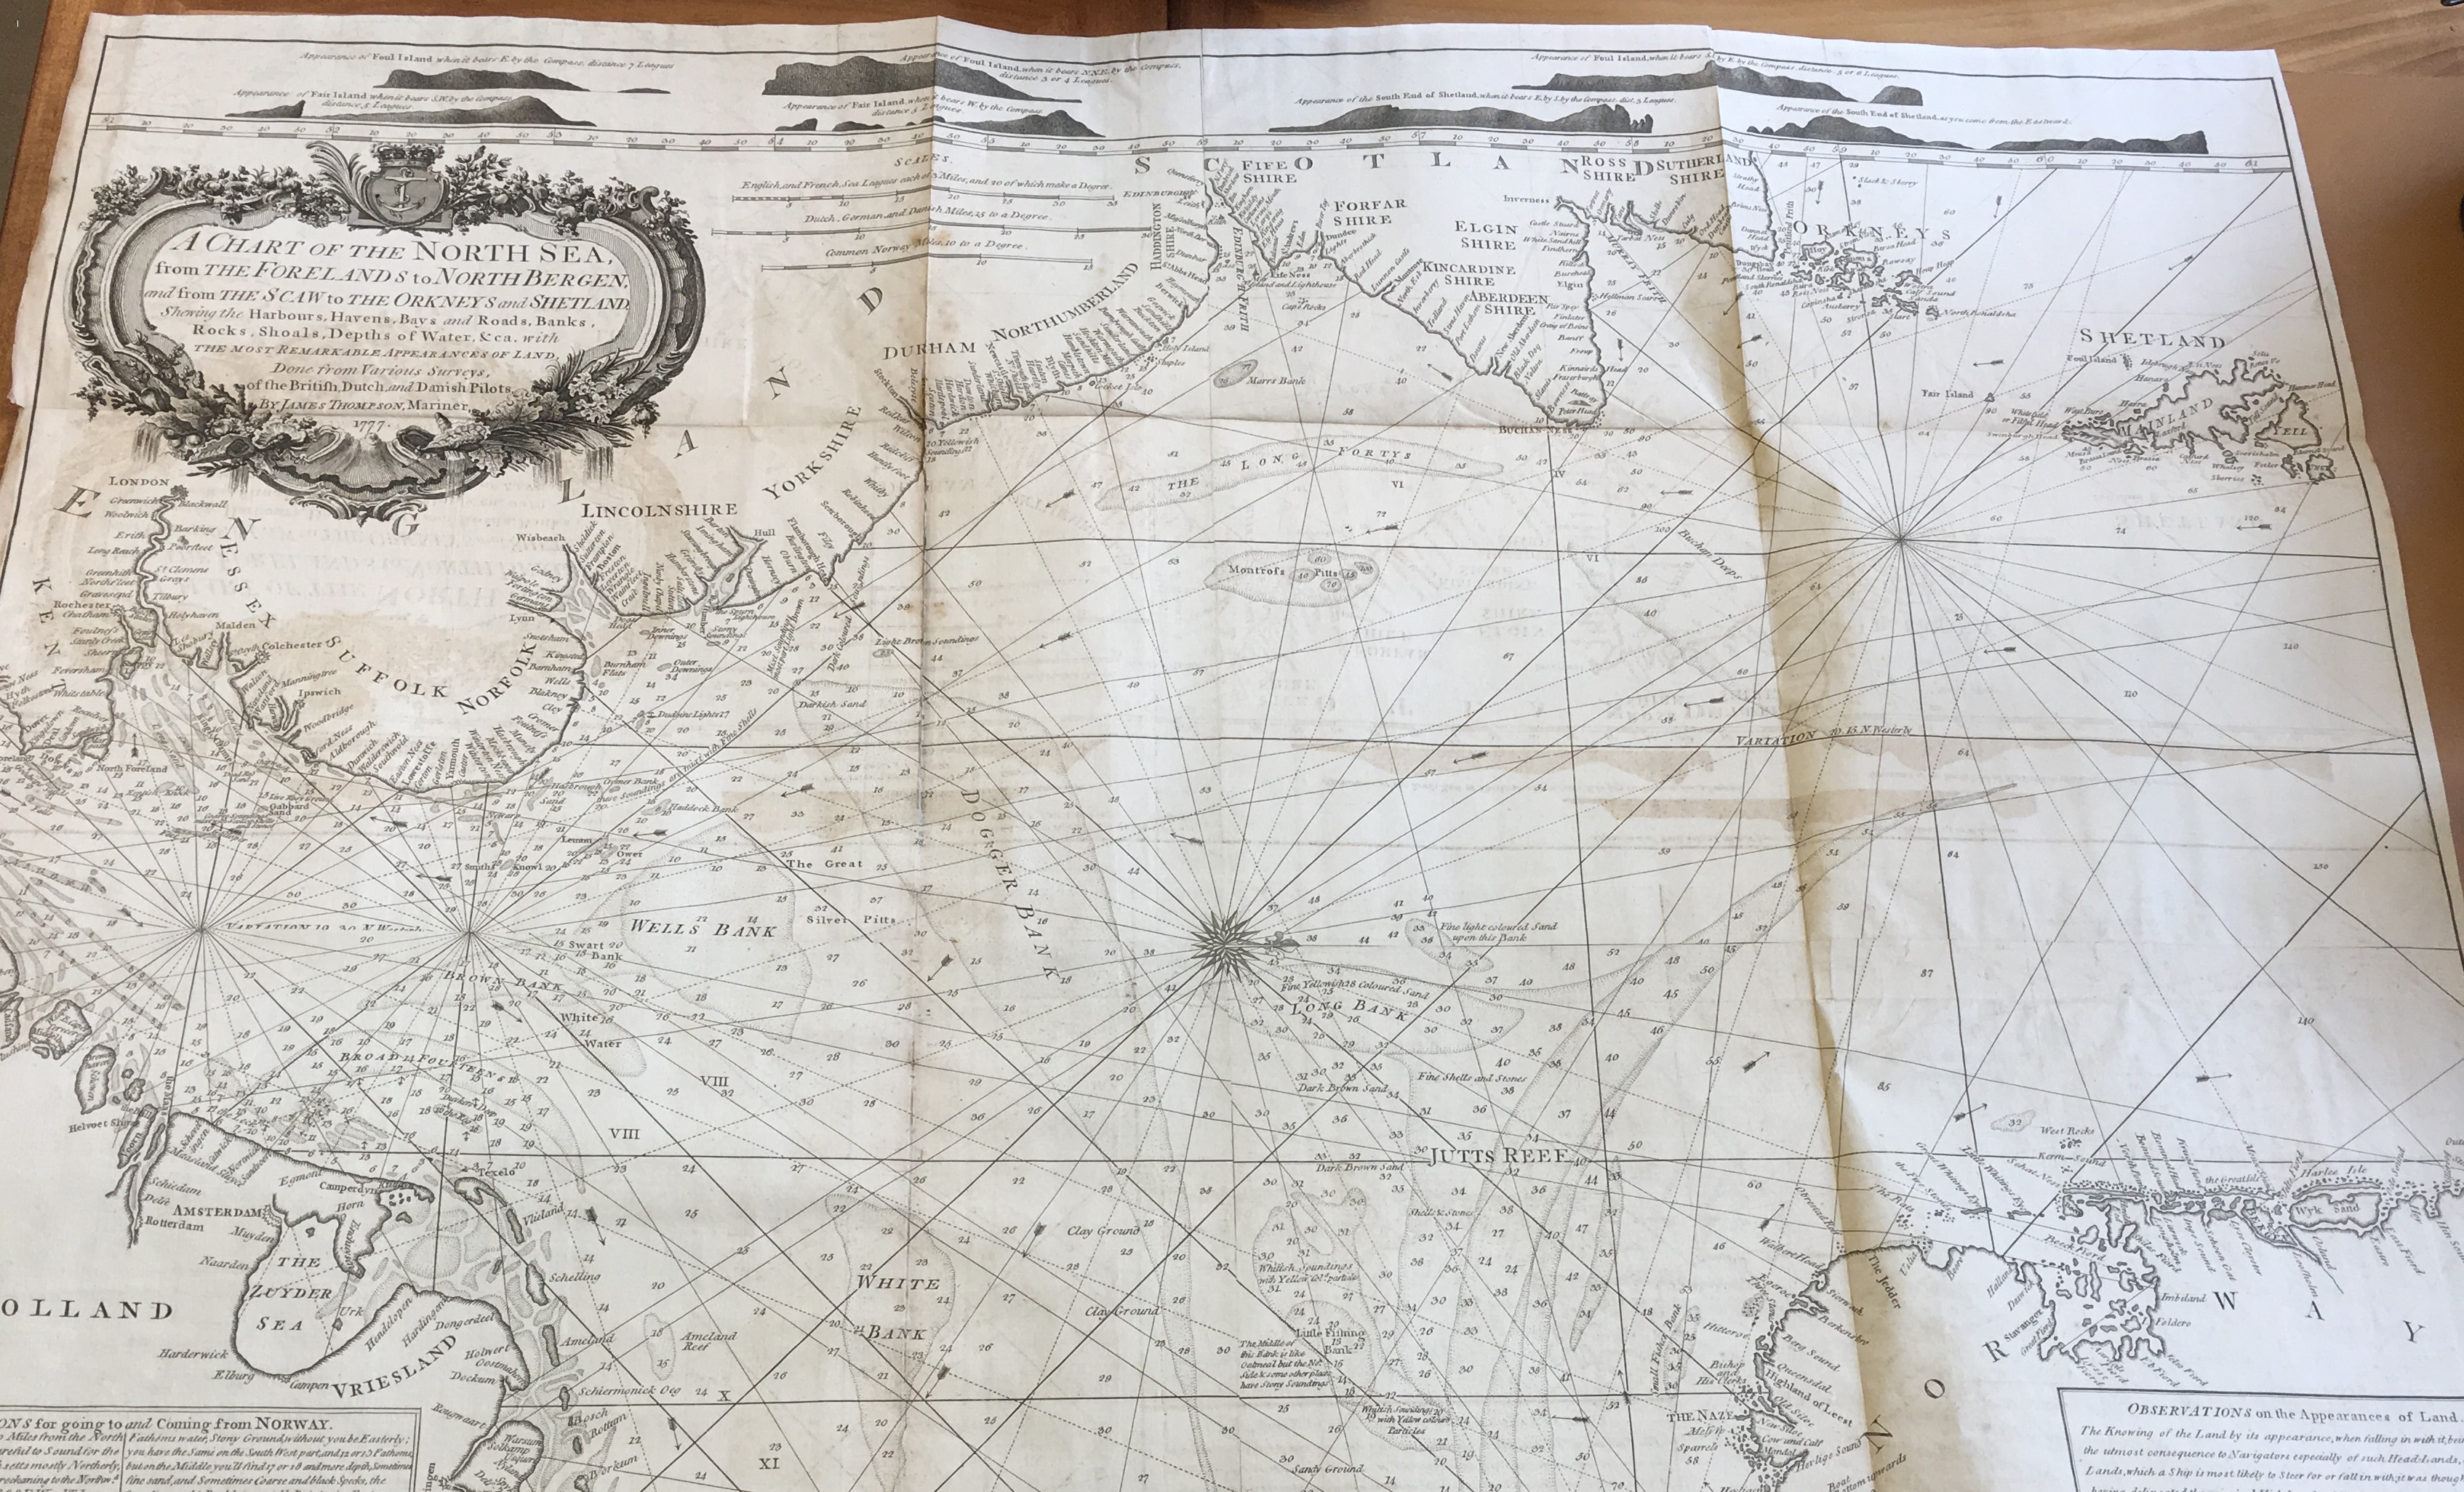
A chart of the North Sea from the Foreland S to North Bergen, and from the Scaw to the Orkneys and Shetland … By James Thompson, 1777

is a detailed sea chart concentrating on the features at sea, with the land barely getting a look in.

Much is made of the many sandbanks which litter this part of the North Sea with interesting reports, one even describing the Little Fishing Bank as ‘like oatmeal’.


Thompson has also includes several land profiles or “remarkable appearances of land” of coastal features and a descriptive panel to aid the seamen in their navigation. The presence of an identifiable building, such as a church or a distinctive geographical feature were as effective as signposts to mariners.

The other unusual thing about this chart is that for no obvious reason it is oriented with west at the top.

Not a lot is known about John Thompson apart from he described himself as ‘Mariner’ and so was most likely the captain of a vessel crossing the North Sea frequently enabling him the survey the area in such a detailed manner, as shown by the sheer number of soundings. This is in the same vein as Captain James Cook who was doing much the same thing in the Pacific at the time.  It appears that this is Captain Thompson’s magnum opus and is found a small collection of seven charts by sea captains-hydrographers all published in the late 18th century, most by Robert Sayer and John Bennett in London.


A chart of the North Sea, from the Foreland S to North Bergen, and from the Scaw to the Orkneys and Shetland. [1777] (Vet.) 20122 a.13 (3)


A lady’s cruise

The Map Room recently acquired an intriguing map entitled ‘A lady’s cruise in a French Man-of-War.’ It shows a route beginning on the Malay Peninsula, which goes southeast through what is now part of Indonesia, to the coasts of Australia and New Zealand, and across the Pacific Ocean calling at many islands including Tonga and Hawaii, eventually ending up in California. The map was produced to accompany a book of the same title, in which Constance Gordon-Cumming gives an account of her travels in 1877 accompanying the Bishop of Samoa across his extensive diocese.

Constance Gordon-Cumming travelled widely throughout her adult life and published many works about her journeys, illustrated with reproductions of her accomplished watercolours. Titles include ‘At home in Fiji,’ ”Two happy years in Ceylon,’ and ‘Granite crags of California.’ She spent time with various bishops, the first governor of Fiji, and with General Ulysses Grant and his wife. Wealthy, well-connected, unmarried and independent, she appears to have had an unusually good time for a woman of her generation.

This particular work includes many observations on the societies she visited; their activities, traditions, homes and beliefs. When describing the animal worship of the Pacific islanders she shows a surprising degree of empathy, drawing parallels with the animal worship of the Anglo-Saxons still revealed in ancient English place names and in features such as the White Horse of Wantage. She criticises the massive international trading company Godeffroy of Hamburg: in Samoa their employees were encouraged to cohabit with female companions from the local community who they were strictly forbidden to marry, and were also advised to obstruct and exclude all missionaries. Throughout the book Gordon-Cumming describes the landscapes, the individuals she meets, the pleasures and privations; the book is really a succession of anecdotes, but an informative and good-humoured one. 

Maps and accounts like this, describing the route of a traveller, are not uncommon; the fact that the traveller in question was female makes this book more unusual. Although the title of the map and book refer clearly to ‘A lady’ as the subject (uniquely amongst her works), Gordon-Cumming’s name appears only as ‘C.F. Gordon-Cumming’ on the cover and title page, without a title or full name which would make her sex obvious; without looking closely one would conclude that the writer was a man. Possibly this was deliberate to make her books marketable;  J.K. Rowling had a similar experience far more recently, a fact which is worth remembering this International Women’s Day.

Pretty in pink

The Ordnance Survey have been producing maps since the early 1800s when the first in a long sequence at 1″ to a mile was produced in preparation for a possible invasion by the French Revolutionary armies. Four sheets were published covering South East England. Over years these maps, through changes in production, design and conversion from imperial to metric have morphed into the 1:50,000 Landranger maps we buy now.

Bottom right sheet of ‘General Survey of England and Wales…’ Ordnance Survey, 1801. Lawn c. 163

Lesser known than the maps we buy in shops are the detailed large scale mapping that have been produced since the middle of the Nineteenth Century and are now available digitally within the library (contact maps@bodleian.ox.ac.uk for more information). Maps at 1:2,500 scale (25″ to a  mile) cover almost all the country (moorland with no habitation wasn’t covered) at such detail that individual buildings and many trees can be shown and the amount of social as well as topographic information is comprehensive. Thousands of sheets were published, and there were in most cases at least 3 editions leading up to the end of the Second World War. This series of mapping included Wales, Scotland and Ireland as well as England. The first edition was available both coloured and un-coloured. As well as a marvellous resource for study the coloured sheets are also beautiful, as this extract of Winchester cathedral shows.


At the same time that the 1:2,500 series was surveyed and produced major urban towns and cities with a population above 4,000 were published at an even greater scale, 1:500. At 126″ to a mile extra space allows for not only much more detail but also the insides of the most important buildings to be shown, so Winchester Cathedral, shown above at a lesser scale within the precinct and the surrounding buildings suddenly opens up like this

Most of the town plans in the Bodleian, including Oxford, are in black and white. A few, such as Winchester here, were hand coloured. There are 27 sheets covering Winchester at this scale, and the amount of infrastructure, and hence the amount of hand-colouring on each, determines the cost. The cheapest were sold for 2 shillings a sheet while the most expensive went for 8 shillings. The Cathedral sheet sold for 7 shillings.

This image of Winchester Cathedral comes from the unusually titled ‘Map of the County of Southampton from and actual survey made in the years 1825 & 1826 by C & I. Greenwood’.


(E) C17:32 (78)