Two intriguing maps of the Channel, both with something special about them.

The first uses hachures (lines on a map to indicated hill slopes) around the coasts which has effect of making the land stand out.

The effect is lovely even if not representative of the actual height of land. The map, titled ‘3d [as in third] chart of the coast of France, including the British Channel’ comes from ‘Le Petit Neptune Français; or, French Coast Pilot, for the coast of Flanders, Channel, Bay of Biscay, and Mediterranean’, published in 1793 by W. Faden, Geographer to his Majesty and to his Royal Highness the Prince of Wales. The book was published 4 years after the start of the French Revolution and just a year after the new French Republic was founded. Despite this the book has an innocent intent, a Coast Pilot is an aide for navigation and sailing and this map includes the familiar rhumb lines and compass rose that are found on sailing charts, and there seems to be no mention of any danger in sailing around and into France along the tidal rivers in the book.

The Paris Observatory is shown, an important building at a time when France was one of the leading cartographic nations. The building pre-dates the Greenwich Observatory and was the site of the Paris Meridian, which has in the past competed with Greenwich to be the main meridian. The map also features along the bottom of the page a cross-section of the land in relation to the sea floor between the Isles of Sicily and Orford Ness.
A French alternative to the Faden map is a map of the Channel by the French ‘Ministre de la
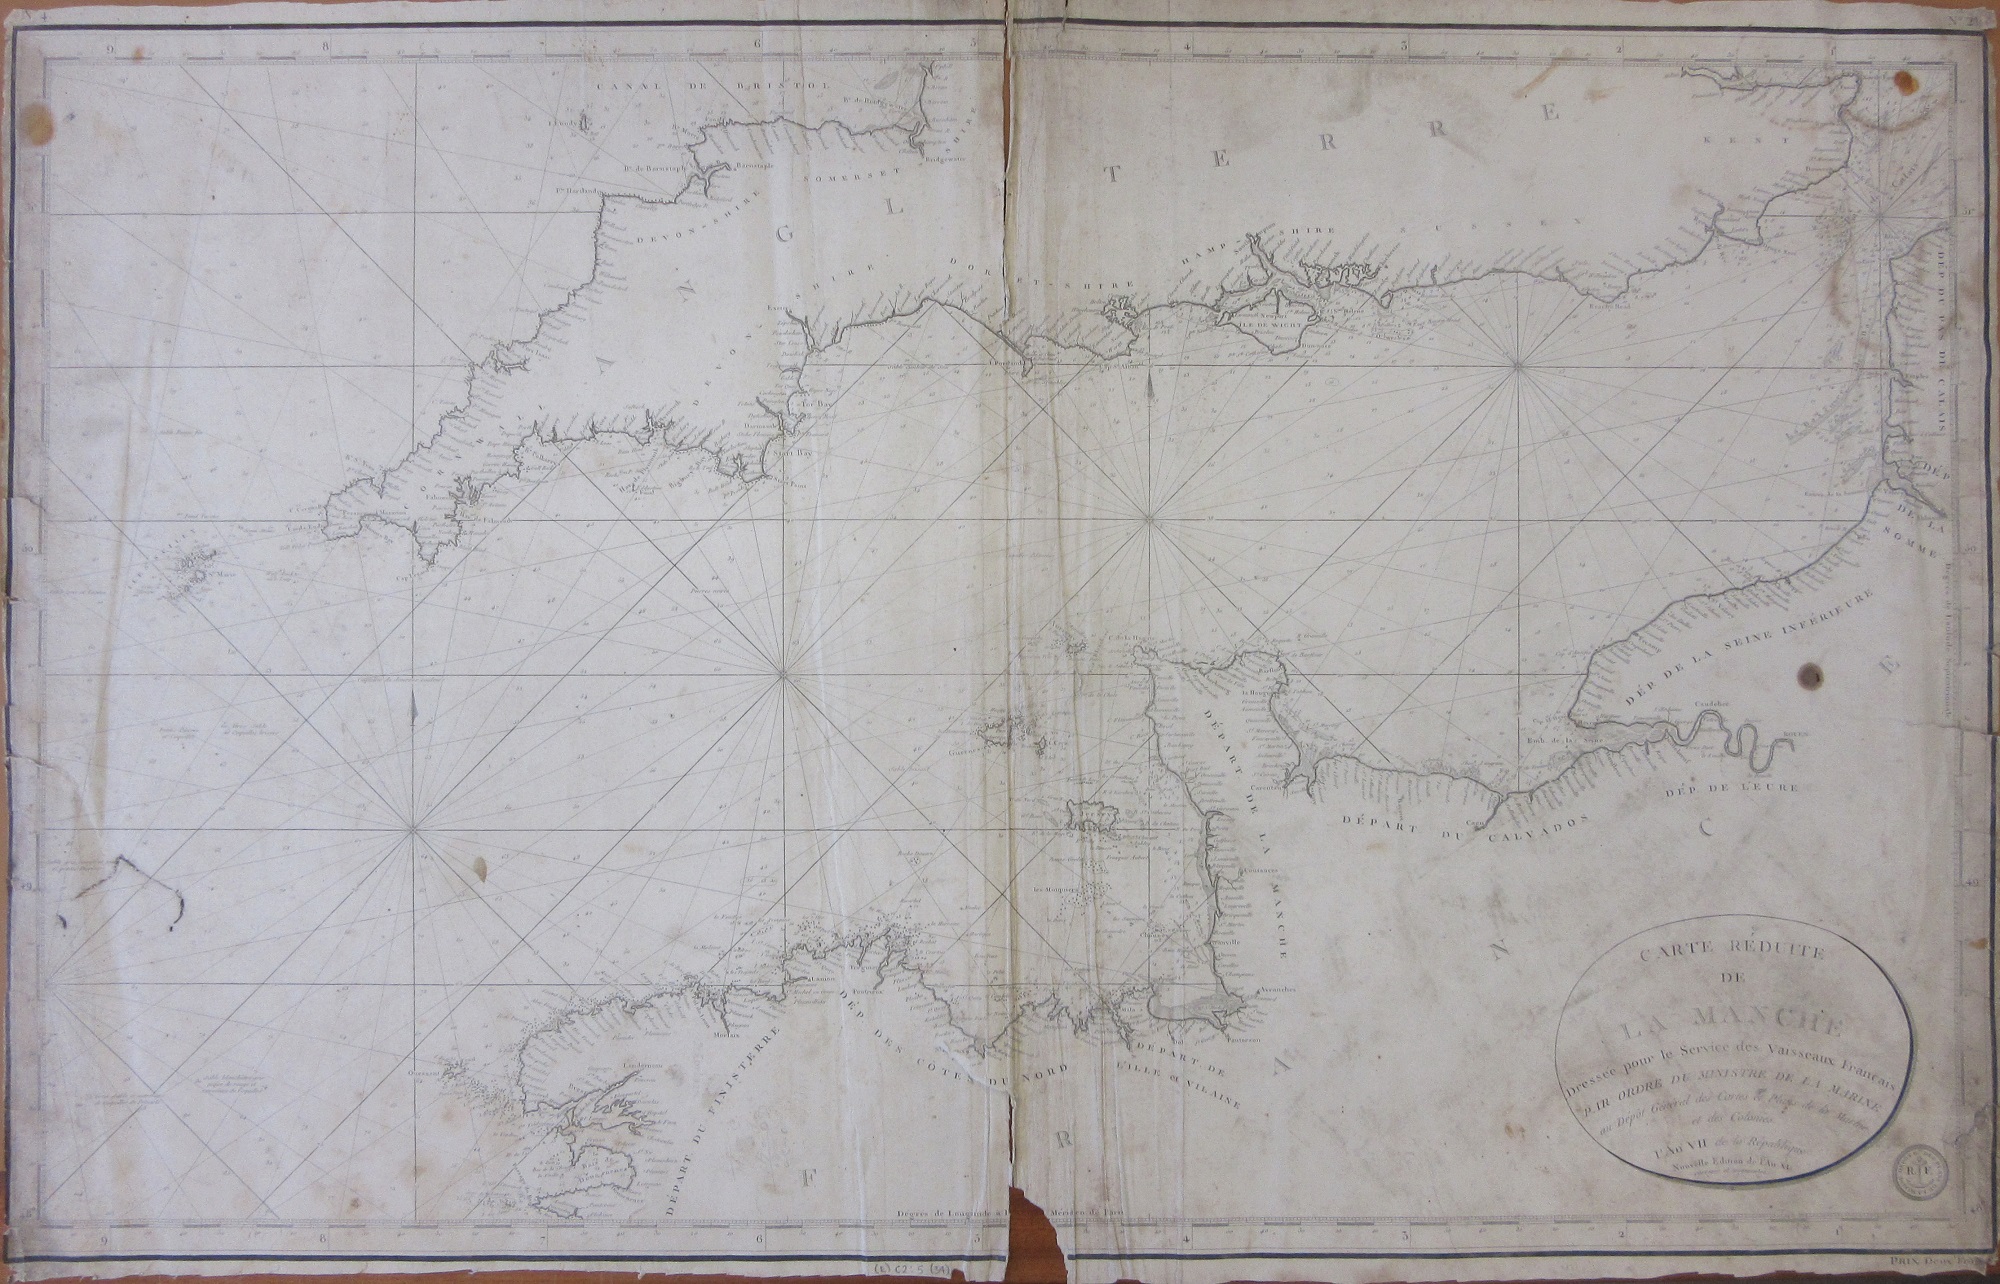
Marine’. What is interesting about this map is the dates given, ‘ I’ An VII de la République, nouvelle edition de I’ An XI’. Following the start of the Revolution a new way of recording years was implemented but as this introduced towards the end of 1793 there is no year one, year two goes from 22nd September 1793 to 22nd Sept. 1794 with the years numbered after this. Our map, ‘Carte réduite de La Manche’, was first published in year VII (1799) and then reprinted in XI (1802), during the planning and build up of resources for a possible invasion of Britain by Napoleon which was called off in 1805. It is one of the few maps in the library dated this way.

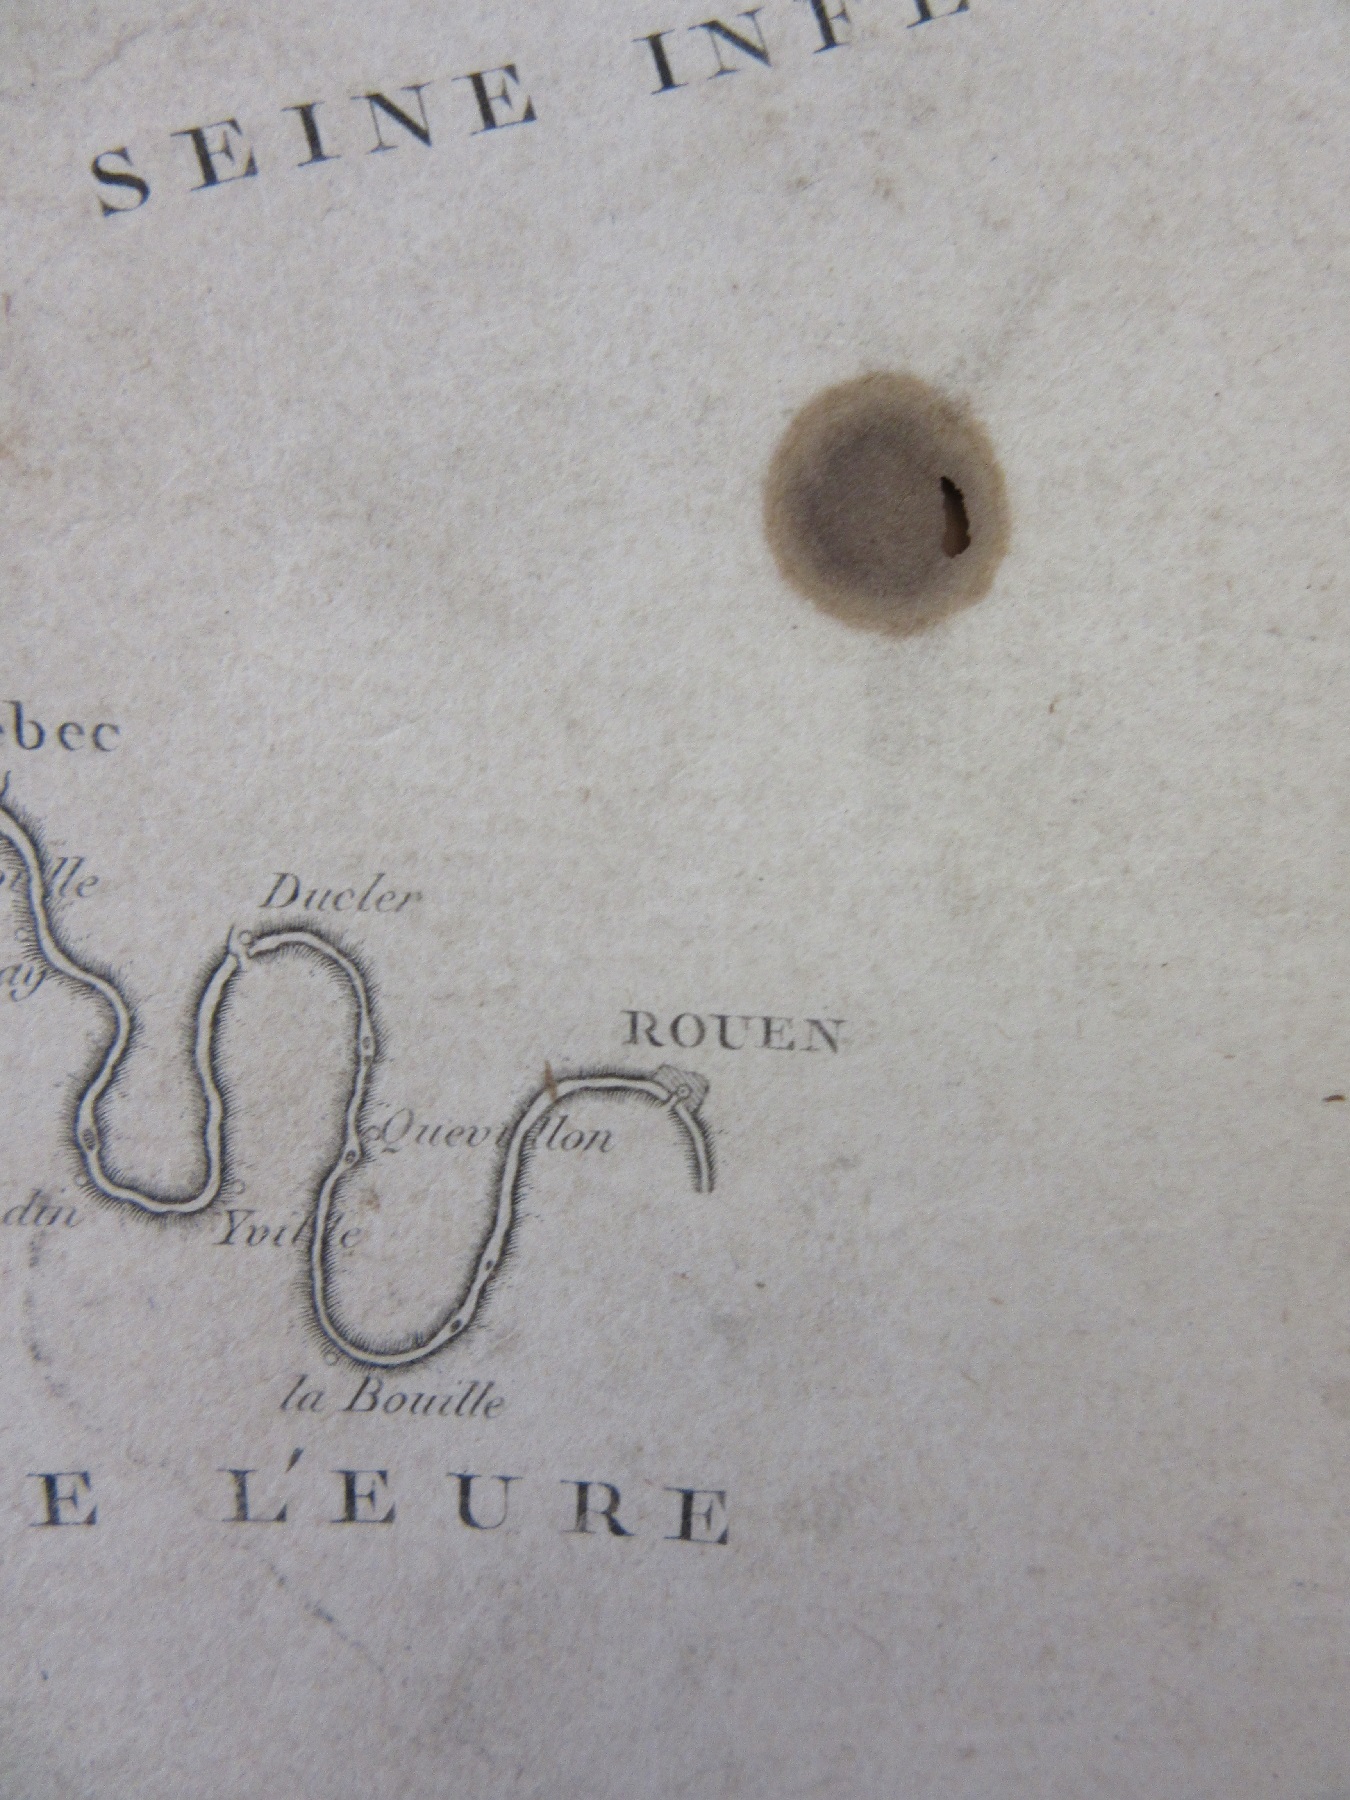
The map has seen better days, as can be seen be this burn mark just above Rouen.
Le Petit Neptune Français; or, French Coasting Pilot…’ 1793. W. Faden Vet A5 d.570.
Carte redutie de La Manche… 1802. (E) C2:5 (34)