
Between July 2019 and this March the Bodleian put on a major map exhibition, Talking Maps, curated by Jerry Brotton and Nick Millea. With the World now spinning on a different axis we thought it would be good to relive some of the exhibition highlights and for the next few months staff will pick personal favourites to include in our Map Department blog.
It seems appropriate (or cruel, depending on whether your glass is half full or half empty) considering the lockdown to start with a map which deals with going to the pub. The Drink Map of Oxford is one of the most popular maps we have, it features in a lot of ‘show and tells’ map staff put on and was a popular subject during our lunch talks when the exhibition was on.

Drink map of Oxford 1883. C17:70 Oxford (7)
Over a simple skeleton plan published in 1883 the location of 319 pubs, breweries, beer houses and other licensed premises are shown using four different red symbols. Most pubs are on the main streets of the city (note how many are on the High Street for instance), while the breweries are close to the castle where there is easy access to water. Beer houses are where residents have applied for a licence to sell alcohol out of their houses to supplement income and are usually on side and residential roads, while other licensed premises are the Wine Merchants and groceries selling to the colleges and the public.

There are some intriguing aspects to this map. The first is the lack of University buildings 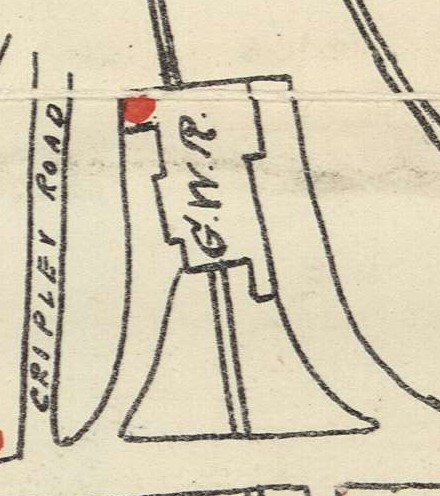 shown, making this the only one of over 300 maps of the city held at the Bodleian with no hint of a University. There are a couple of reasons for this. Being a skeleton plan buildings aren’t included to keep the map as simple as possible (the railway is there as it is an important part of the city make-up, and also, more importantly, there is a pub in the terminal building as well). The second reason is that students weren’t allowed into the city pubs. Colleges would have had their own bars and some even brewed their own beers. Another aspect to the Drink Map is the wonderful irony in something which shows just where you can get a drink in Oxford but which is published by one a number of Temperance Societies in the city at the time, the rather grandly named Oxfordshire Band of Hope and Temperance Union. Temperance Societies were concerned about the problems alcohol was causing for the Working Class, causing problems such as poverty, crime, the breakdown of the family and church attendance. Text on the back mentions the effect of all this drinking in such a renowned city, ‘drunkenness abounds in our midst, and its attendant evils, crime and pauperism, are ever calling our attention. Can this be wondered at seeing we have up to three hundred places licensed by law for the sale of strong drink?’ The text goes on to make two claims
 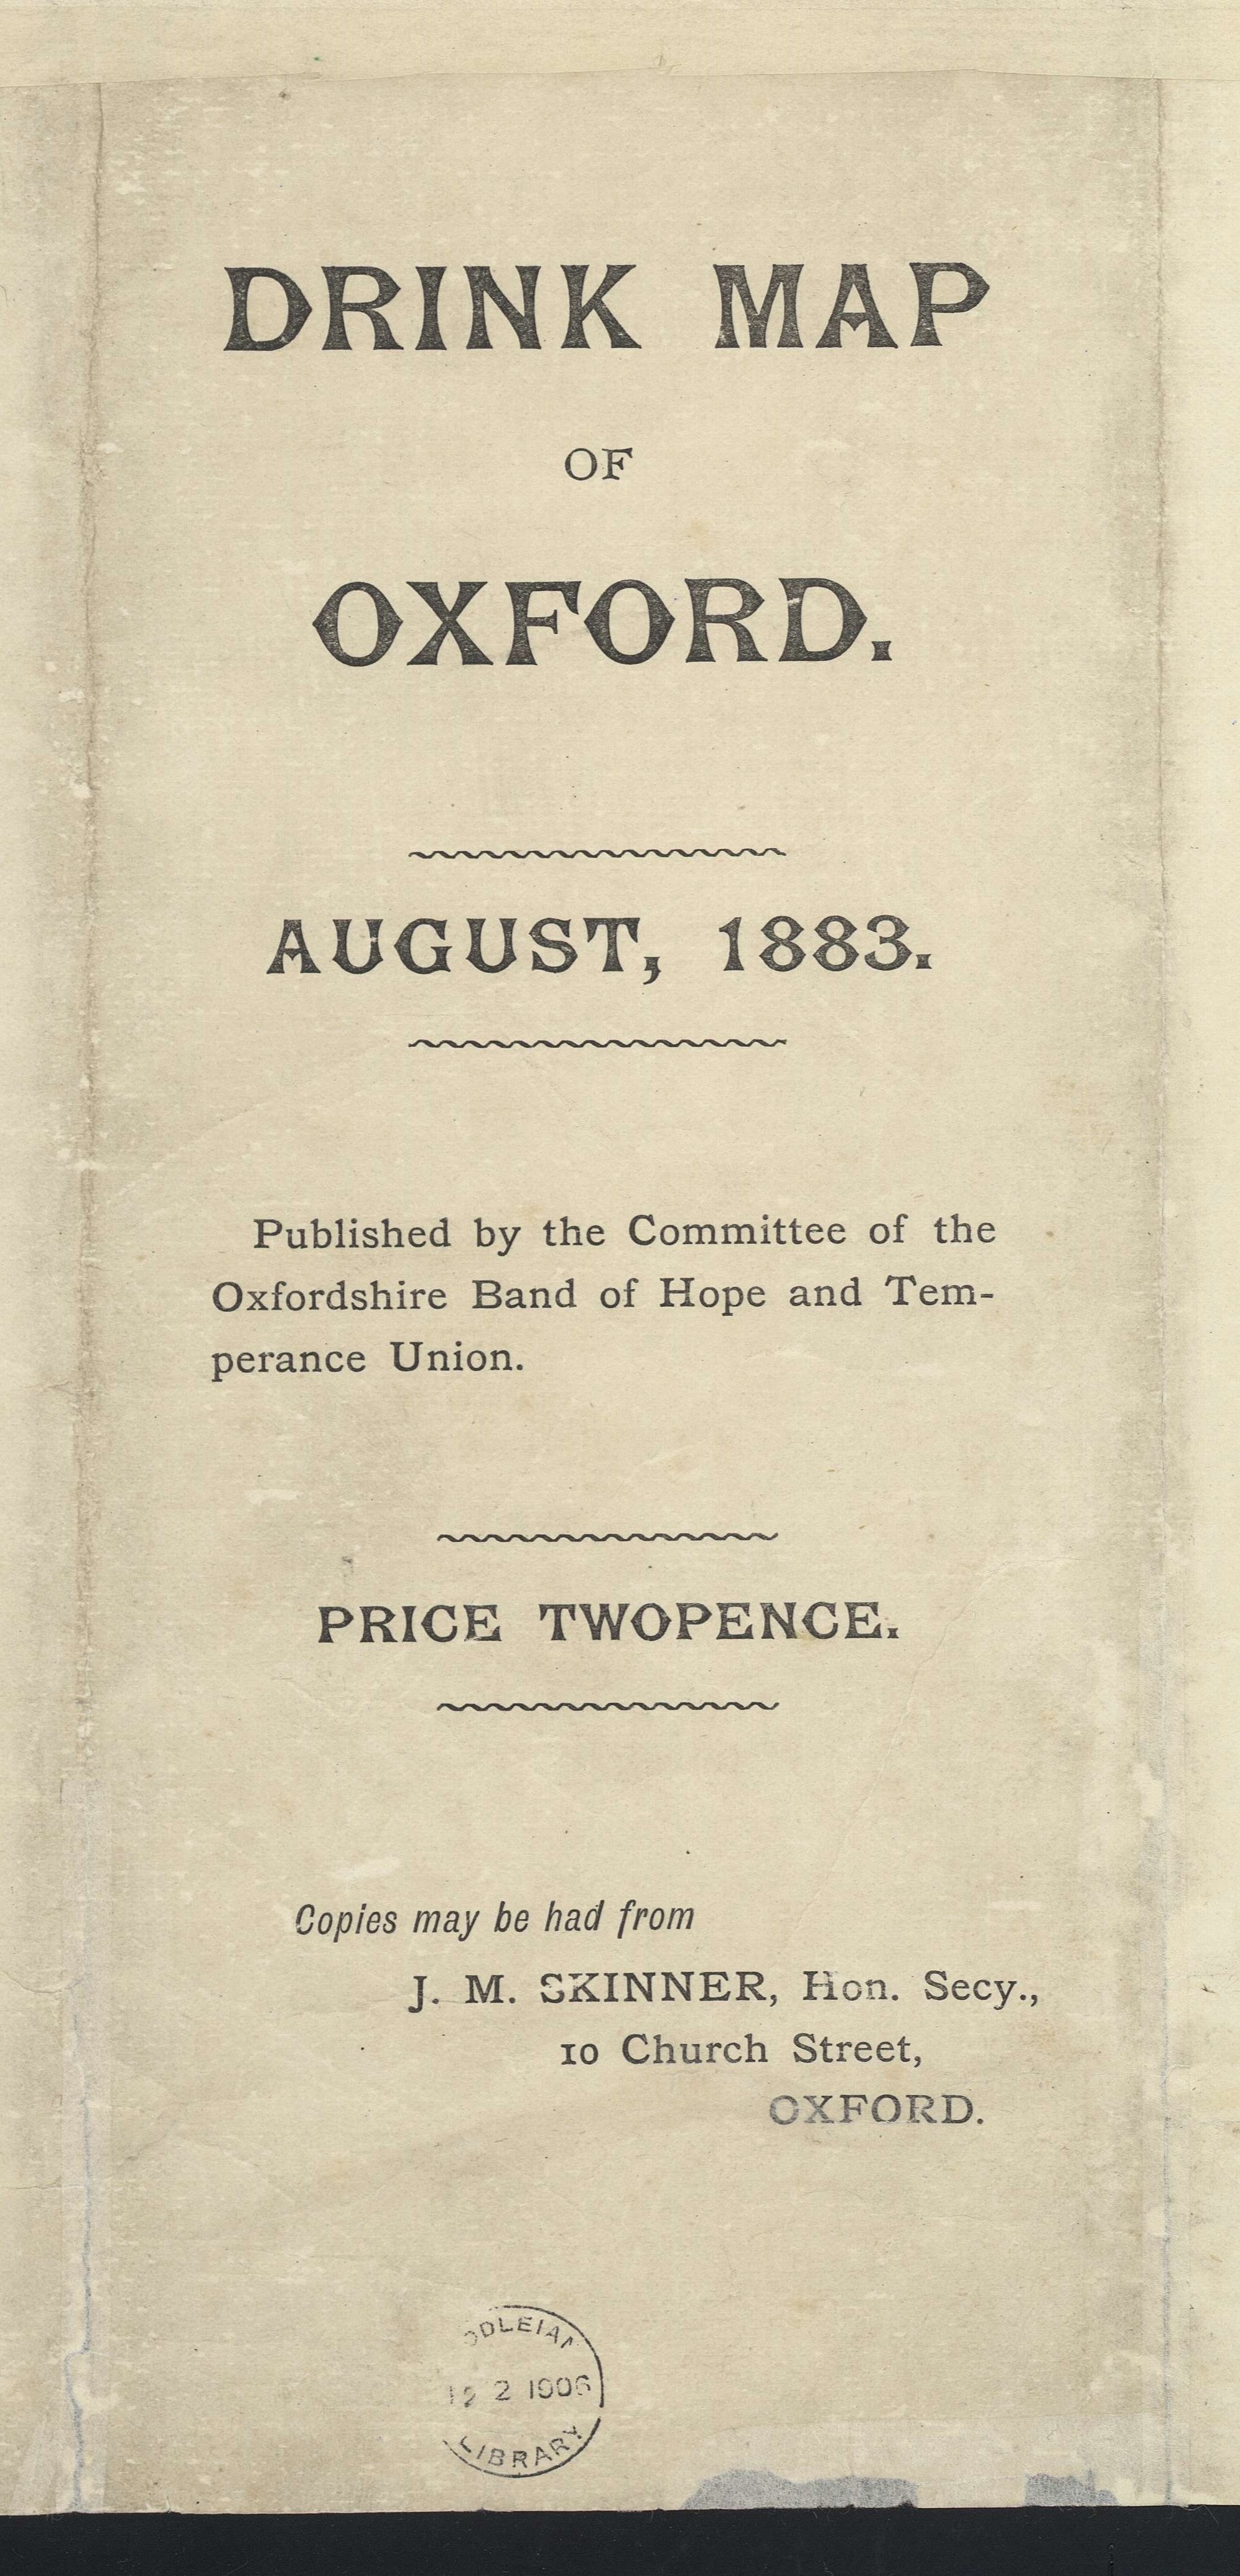 about the city that don’t quite stand up too much investigation. The first is that the city is so overpopulated with drinking establishments that it has 50% more than any other comparable town. While there certainly is a lot in Oxford compared to now there was a lot everywhere. Post Office directories for towns such as Reading show similar numbers. The second claim is that the city magistrates come from the middle and upper class residents who tended to live in the north of the city, and while they were happy to give licences to places in the poor areas aren’t so keen to do so closer to home, hence the disparity between the north and other parts of the city on the map. Like the comparison with other towns this accusation doesn’t stand up when you use the directories. Kelly’s Post Office Directory for Oxford 1883 lists the names and addresses of the 16 magistrates in office for that year, with only a few living in the north of the city. Some magistrates live on the High Street while one even lives next to a beer house in St Clements. What is closer to the truth about the lack of pubs in North Oxford both then and now is that St Johns College owed most of the land and they were putting restrictions in place on the use of land in sale and leasing agreements which included the sale of alcohol.
There is an important companion to the Drink map that makes an equally strong social statement about Victorian Oxford. Dr. Acland’s map of major cholera outbreaks in 1832, 1849 and 1854 to
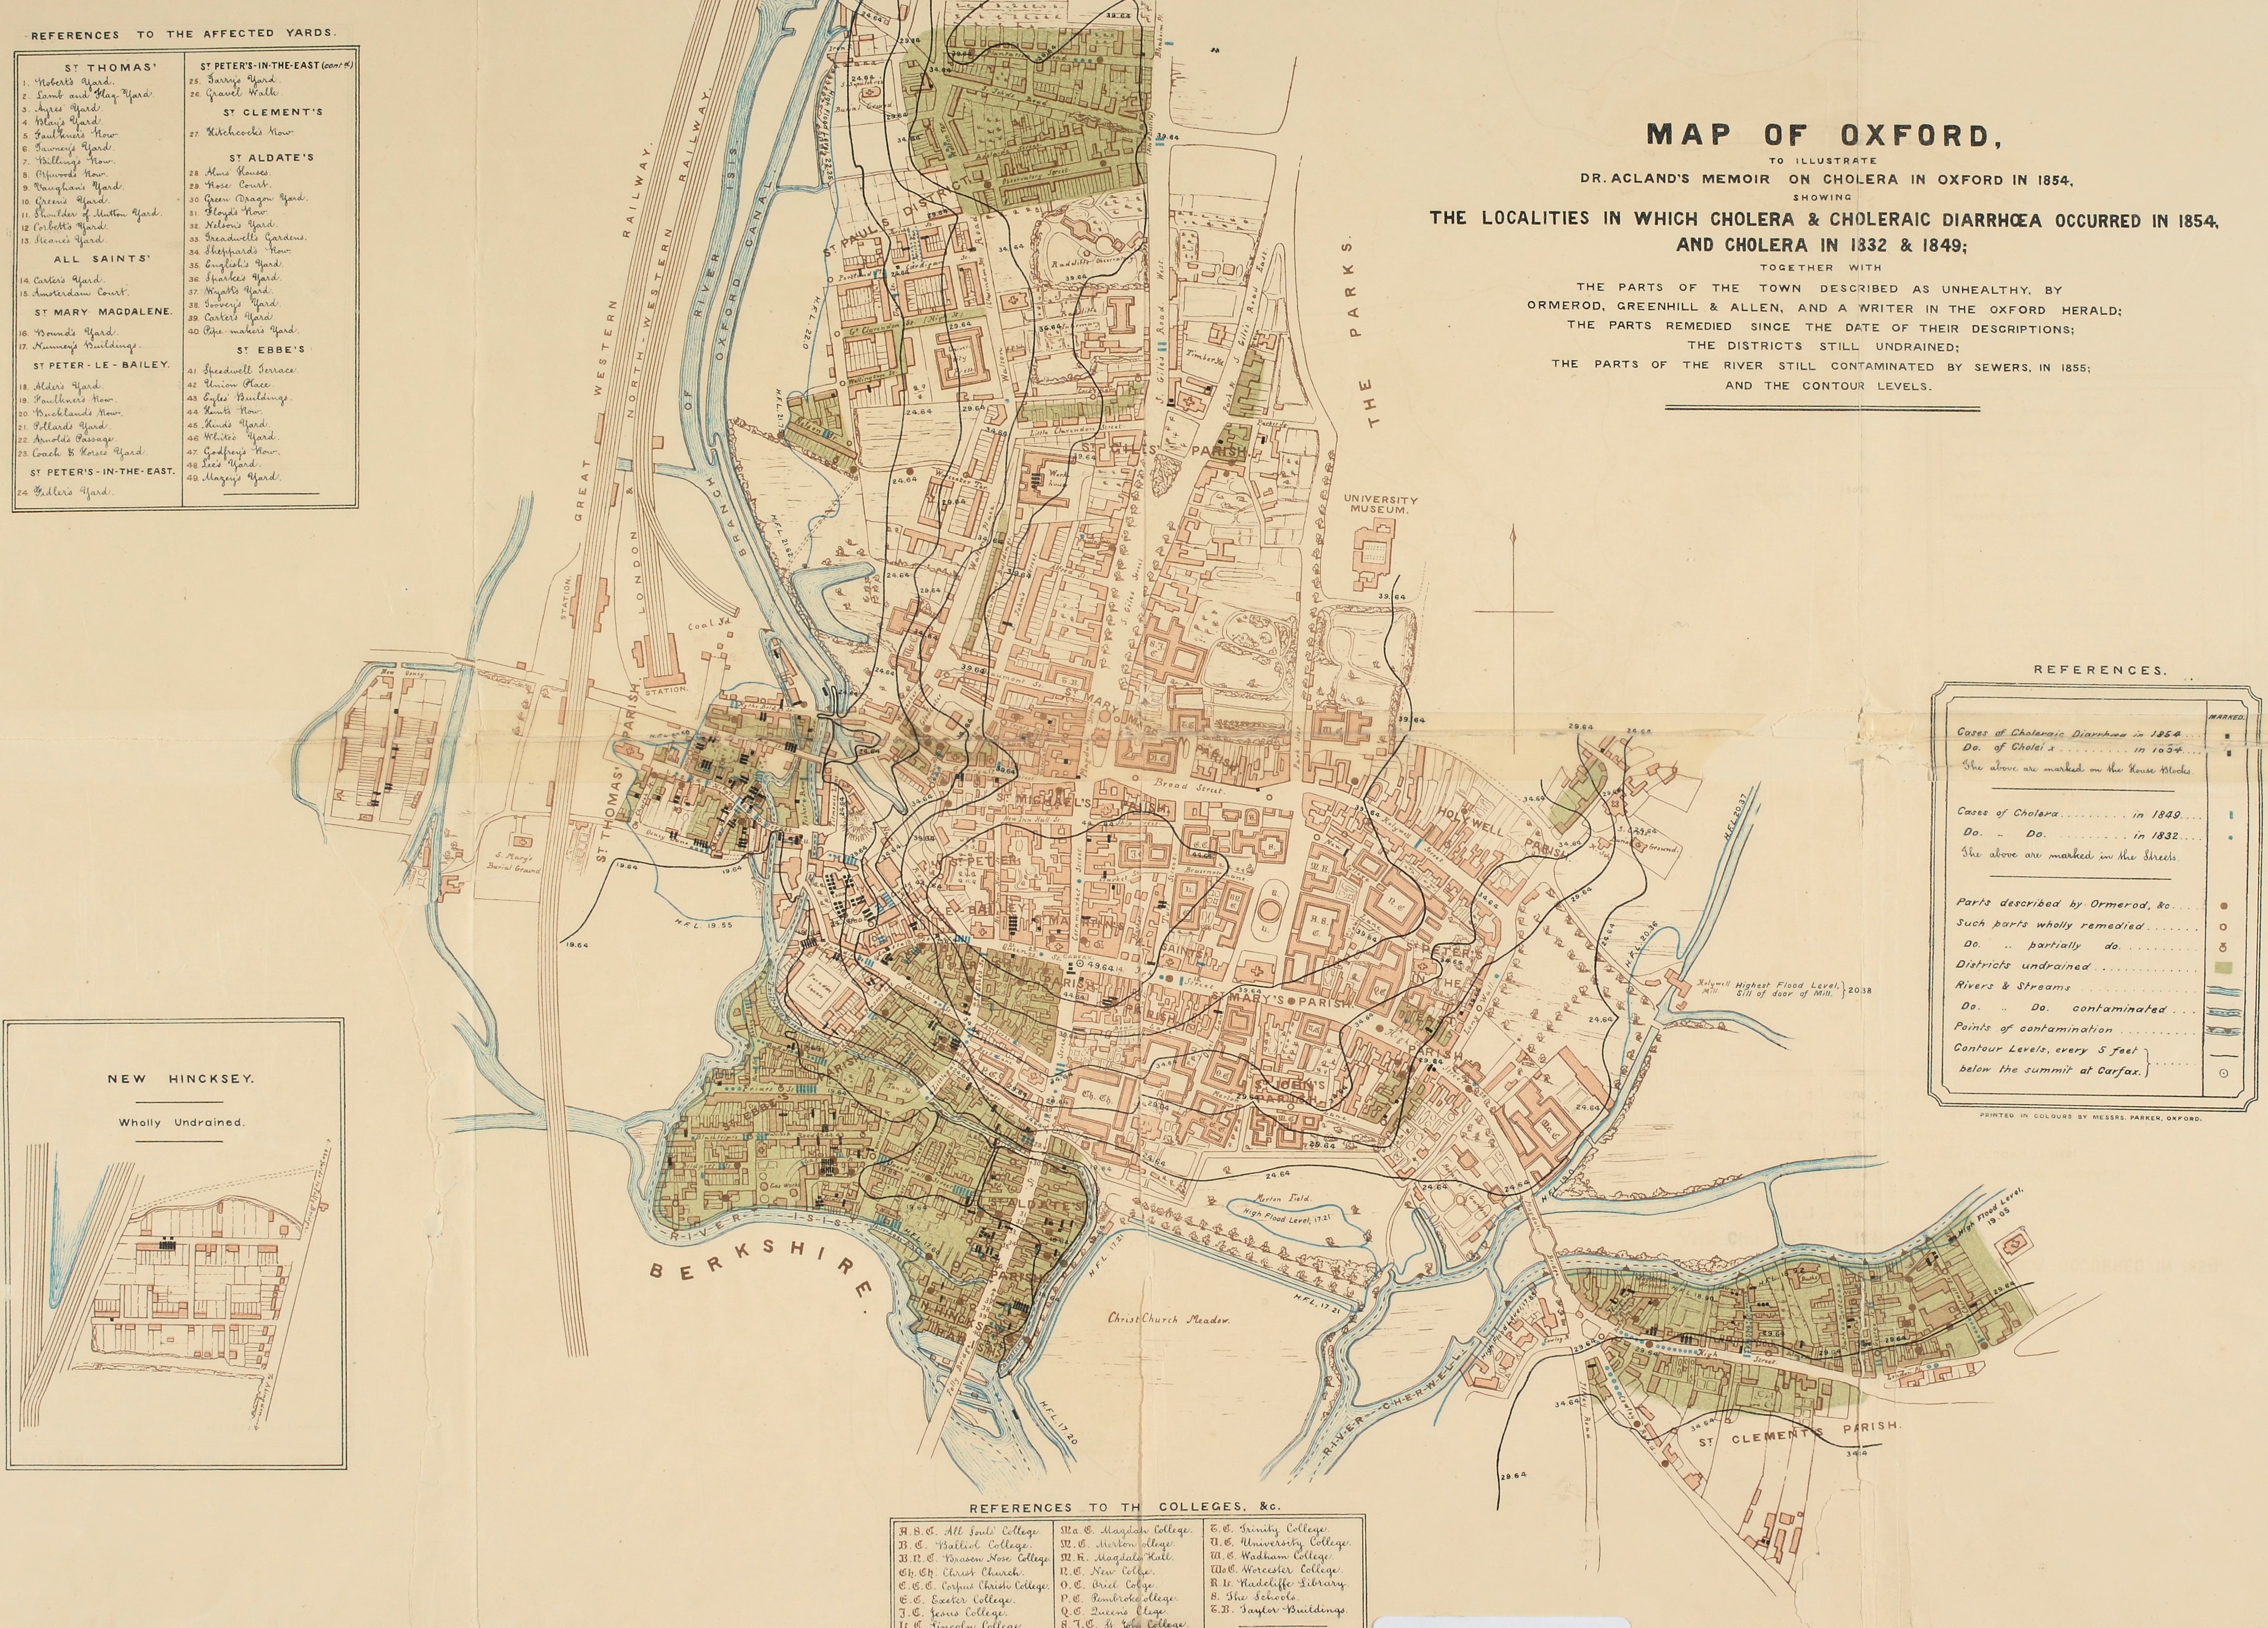
Map of Oxford to illustrate Dr. Acland’s memoir of cholera in Oxford in 1854… 1854. C17:70 Oxford (15)
accompany a report in 1854 is one of the earliest disease maps published in England. The map shows areas of poor or no drainage, the contaminated sections of river and the individual cases of outbreak and it is the areas of poor drainage that draw comparison with the Drink Map. The areas that feature strongest on the one map, the over-crowded working class districts of Jericho, St Ebbes, St Clements and Osney Island which are all heavily overlaid with red symbols are the same areas shaded to show areas of poor and no sanitation and drainage on the other.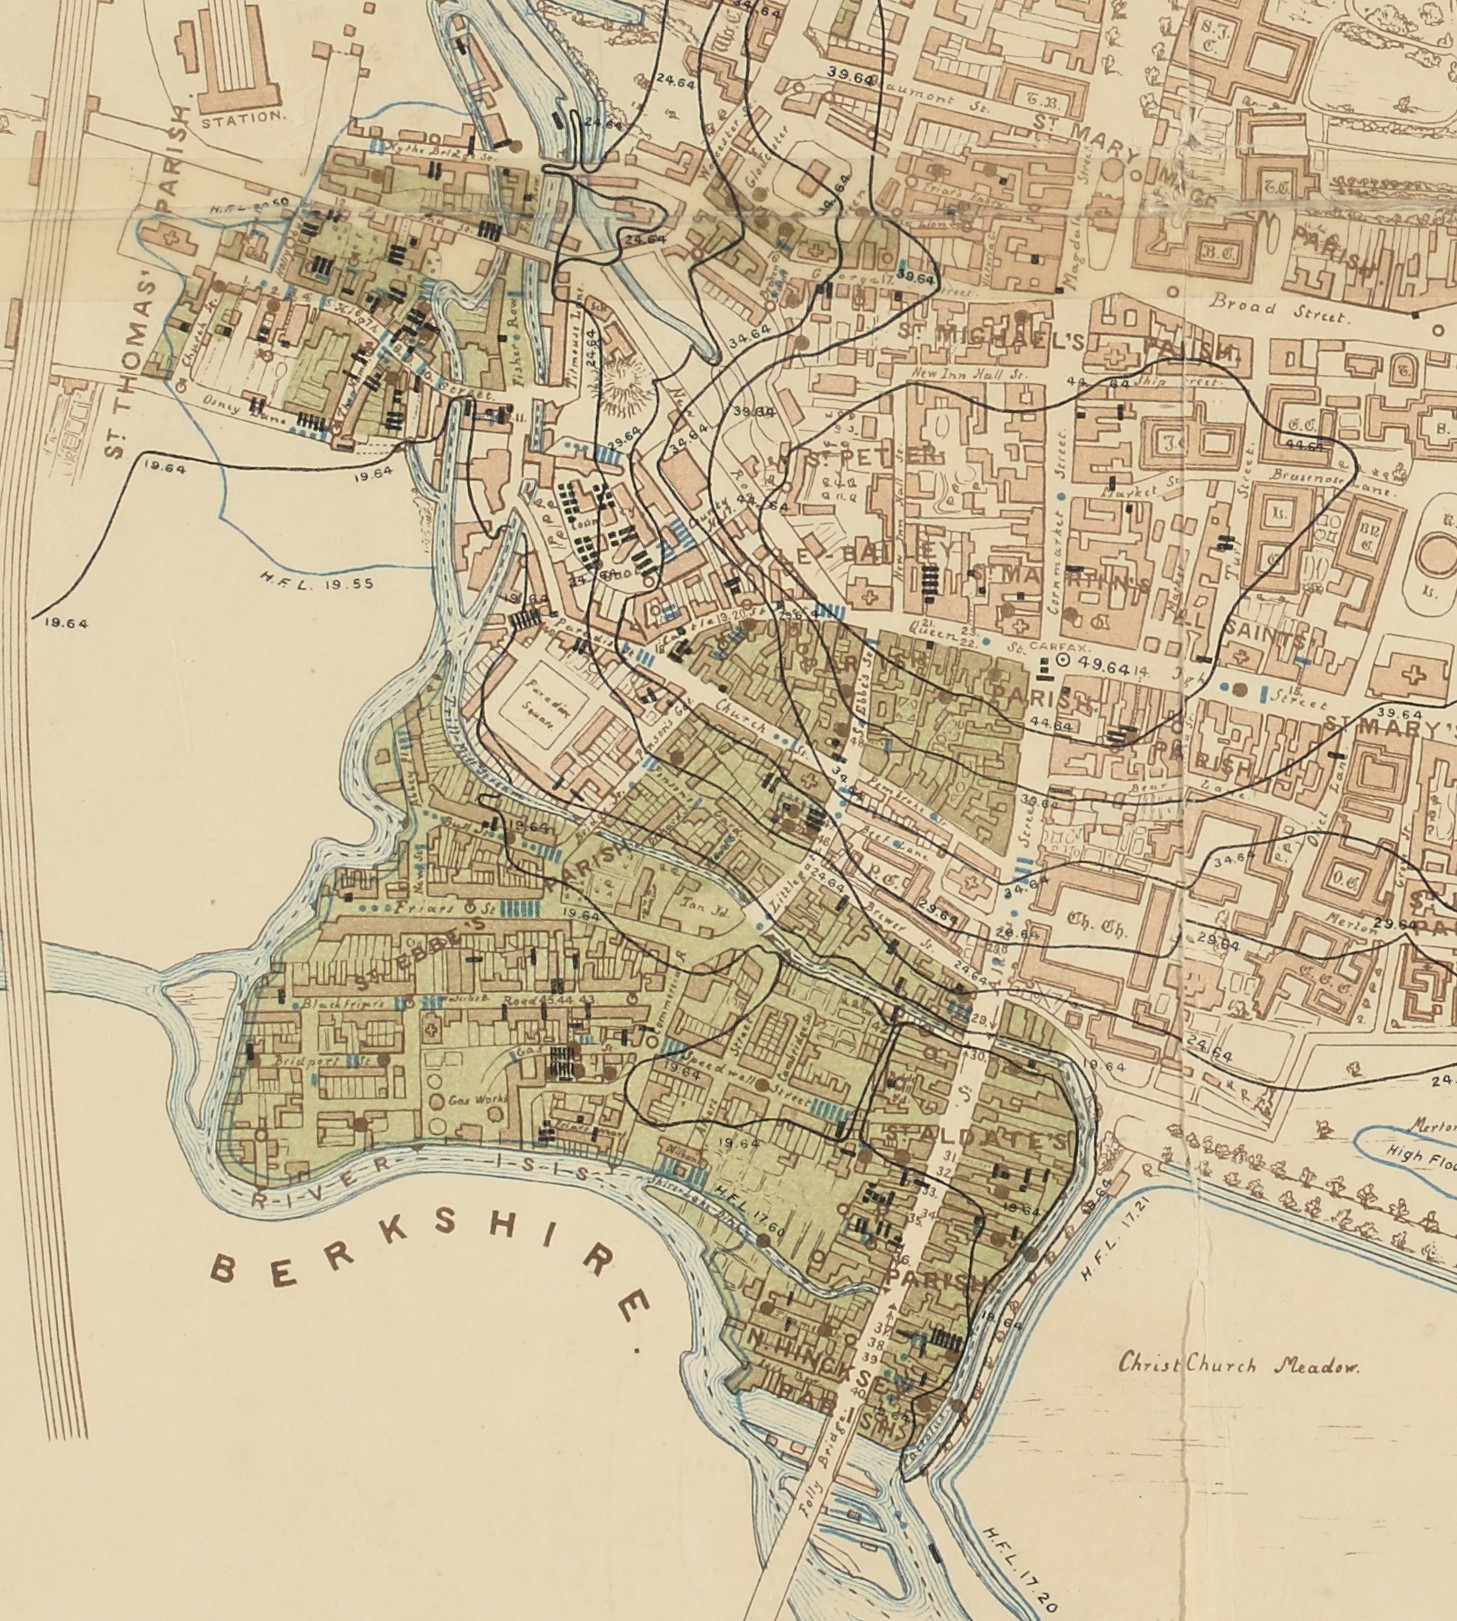
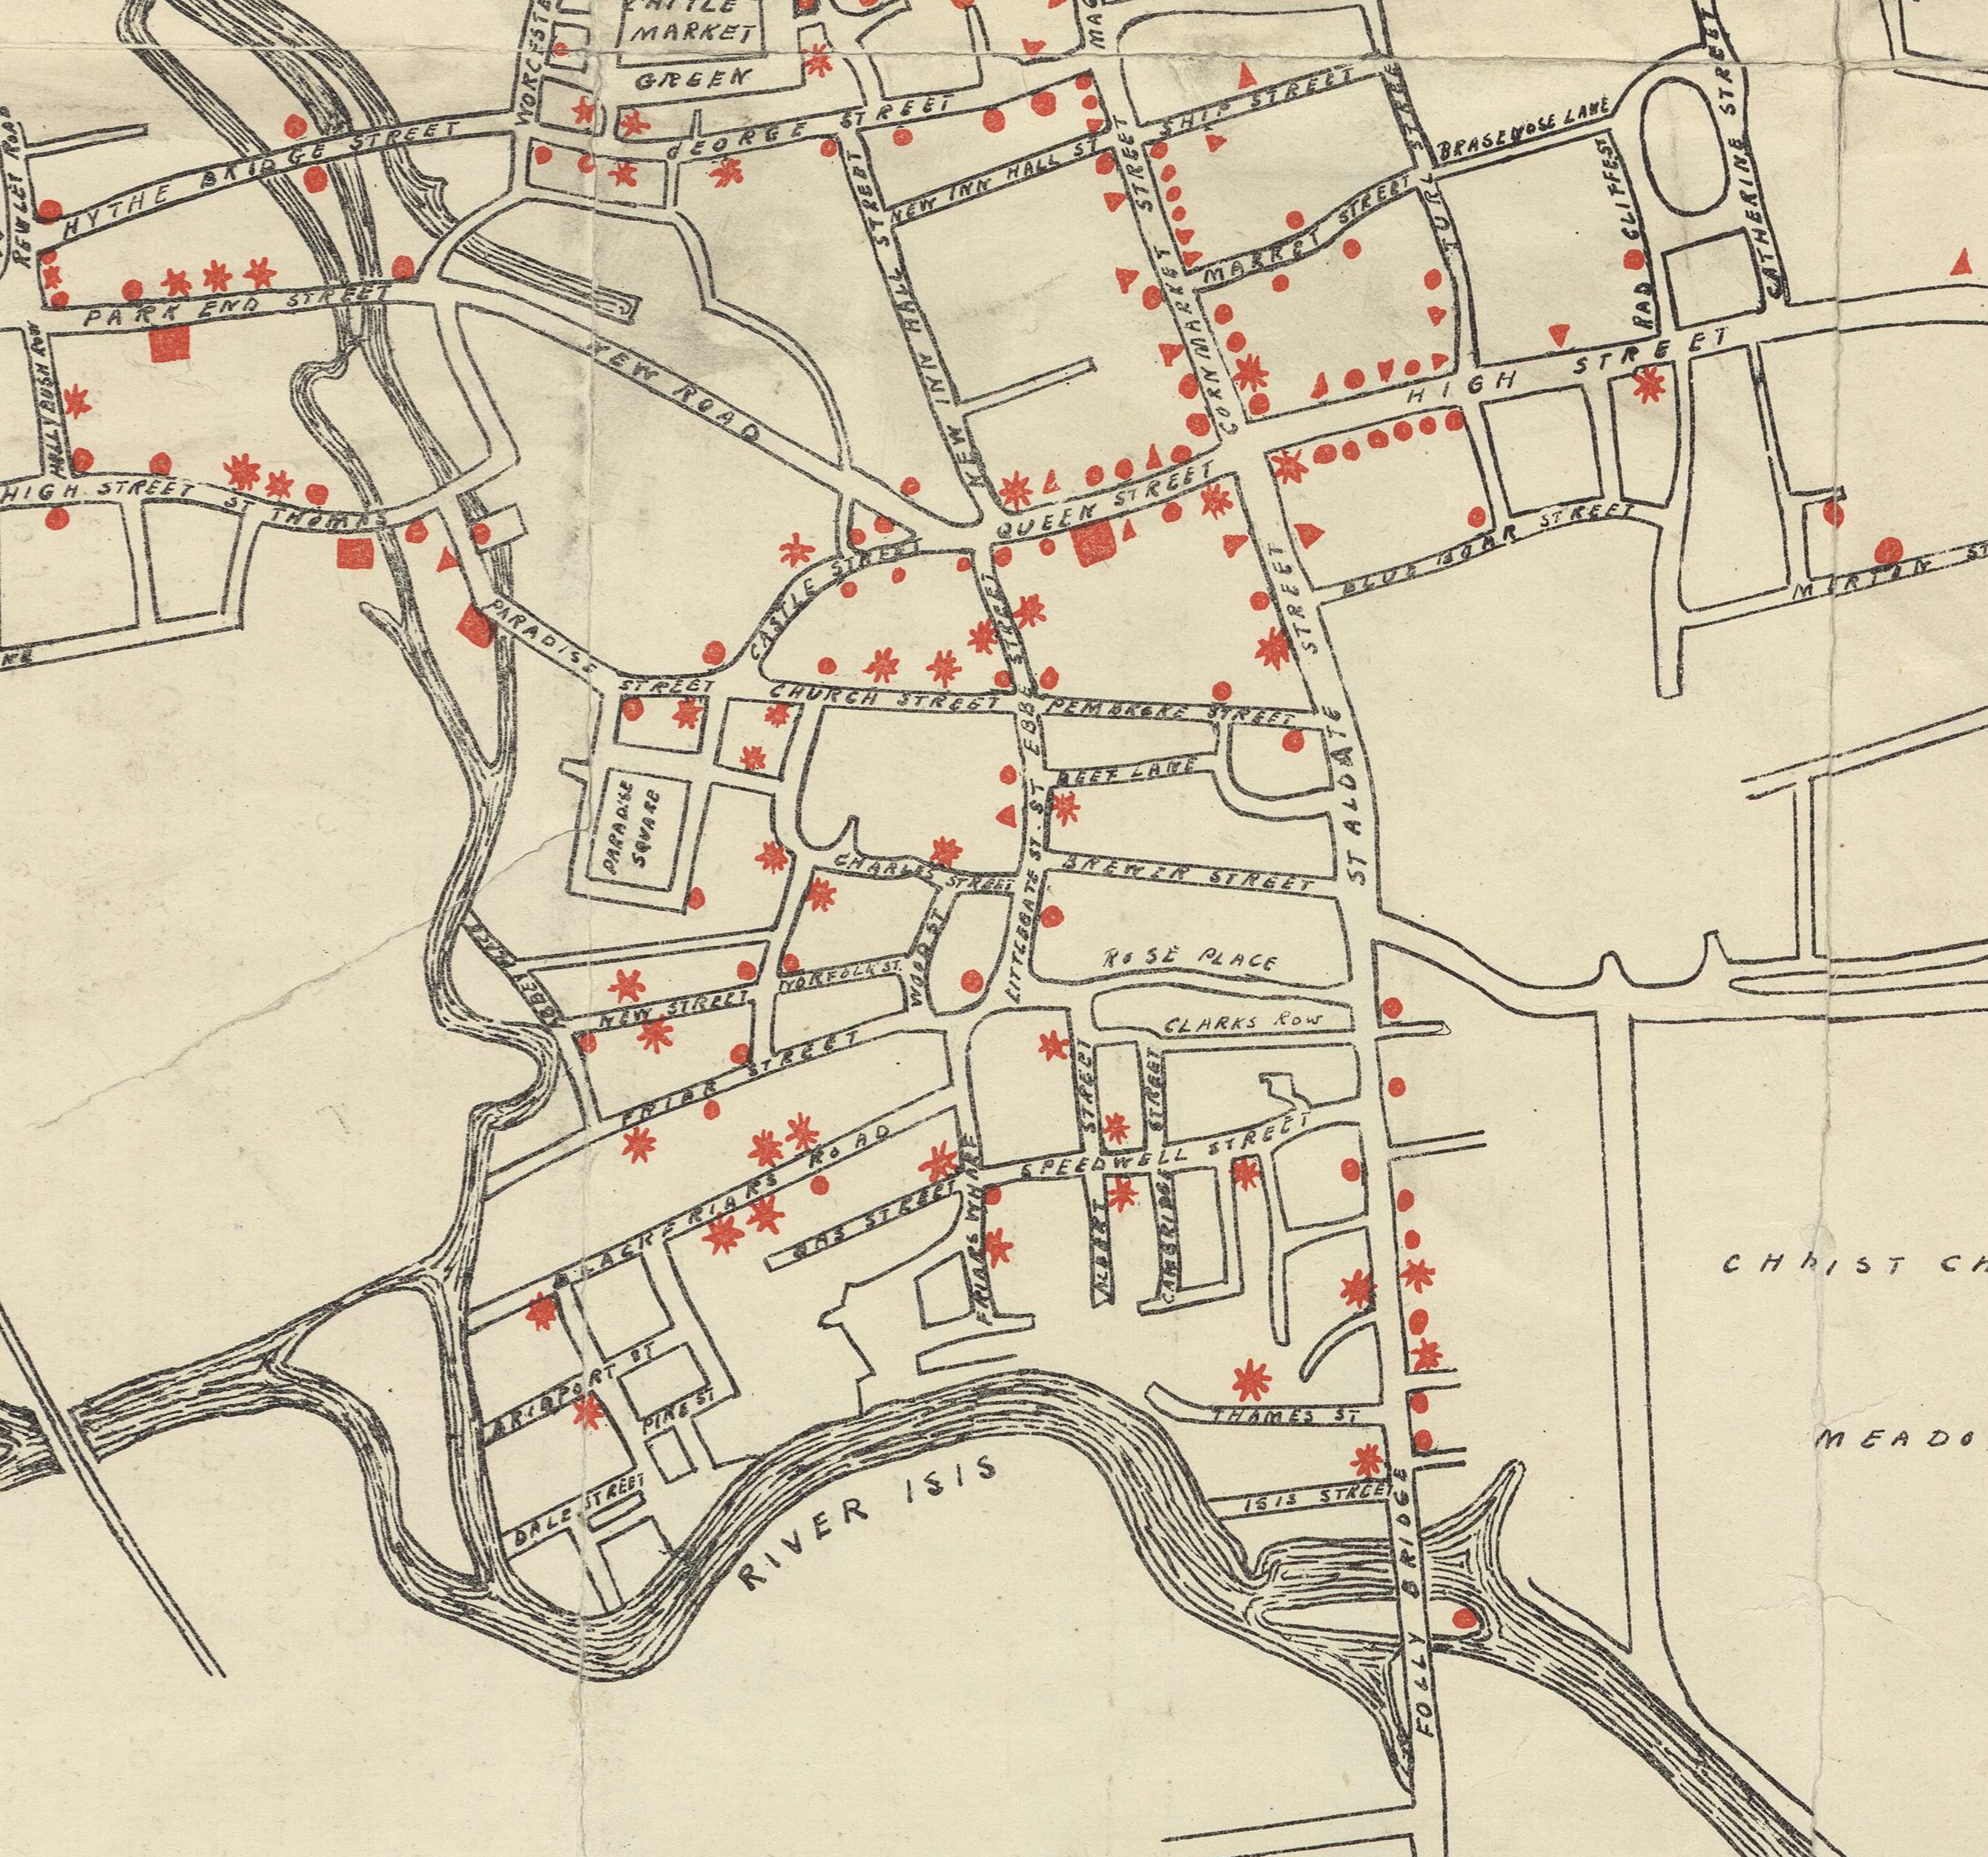
The St. Ebbes area on both the Drink and Cholera maps. Most of this area has been redeveloped and is now the Westgate Shopping Centre.
These are two important maps of the history of the city, coming at a time when the population had grown considerably from the late 1790’s onward’s with the arrival of the canal, the move out of countryside by agricultural labourers following enclosure and the coming of the railway. This increase in population put pressure on the working-class areas with the inevitable problems highlighted in both maps; disease, poor housing, poor sanitation and over-crowding.
These are also wonderful maps full-stop. The cholera plots an illness which was for the time still hard to treat in a city using as their main source contaminated river water while the Drink Map is a serious attempt to highlight an important problem but now, without the social implications involved, looks like a Victorian version of a pub guide.