Monthly Archives: November 2020

Thanksgiving

Today is Thanksgiving, celebrated in the United States and Brazil on the 4th Thursday in November (Canada celebrates on the 2nd Monday in October with a few other countries throughout the World using either of these or dates around these days as well). Thanksgiving is a harvest based celebration, and, more importantly here, is also connected with early English settlements in the United States. It’s a chance for us a post a blog featuring one of the treasures of the Library, John Smith’s beautiful map of Virginia, dated 1612.

Smith was Governor of the Colony of Virginia and one of the founders of Jamestown, the first permanent English settlement in the United States. Smith’s map is orientated with west at the top, the best way to represent on paper this elongated stretch of country. The Chesapeake Bay is the 
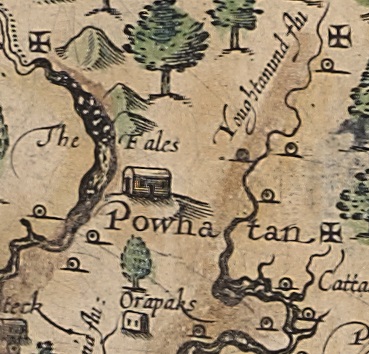
horizontal stretch of water just below the centre of the map with Jamestown, in red, on the Powhatan (now called the James) River. Smith shows the areas both explored, often by himself, and unexplored, using crosses on the rivers to show the limits of European knowledge. Most striking though are the images of Native American life, on the left is a scene showing the local chieftain Powhatan and members of the Powhatan tribe while on the right is a Native American with the inscription ‘the Sasquesahanoughs are a gyant like people & thus a-tyred’. Maps played a crucial role in the early history of the United States. Dutch, English and French interests in territory made the setting down of ownership and boundaries on maps and documents a way of establishing claims and legitimacy to land which would go on to play a crucial role in the way the early history of the country developed.

This map comes from a book Smith wrote about his time in Virginia, called ‘The First Booke of the First Decade contanying the Historie and Travaile into Virginia-Britania‘, and came to the Bodleian from the collection of Elias Ashmole, founder of the Ashmolean Museum. Ashmole had donated his collection to the Ashmolean in 1677, this was then passed onto the Bodleian in 1860.

MS. Ashmole 1758. 1612

Measuring distances, a wheel or a chain?

John Ogilby has to be one of the most interesting of all the cartographers. Before turning to making maps aged 66 he had at various times been a dancer and dance instructor, theatre manager and publisher, with career changes usually the result of misfortune of some kind. His dance career ended after suffering serious injury during one performance, his career in the theatre in Dublin came to an abrupt end due to Irish rebellion against the English in 1644 and then finally he lost most of his publishing stock in the Great Fire of London.

It was the fire that set Ogilby on a new path as a cartographer. After mapping the devastated city to aid in redevelopment Ogilby embarked on the project that would not only give him lasting fame but introduced a new way of mapping  roads. In 1675 Ogilby published the Britannia, an atlas of 73 routes at a scale, for the first time, of one inch to the mile (1:63,360). As can be seen from this example Ogilby revolutionized the way maps were shown by only focusing on the relevant information for the road user and by making the best use of space while creating maps full of useful information and easy to understand.

Miles are marked on the road maps with furlongs in between the miles shown by dots (a furlong being the length of a furrow in a common field, by Ogilby’s day there were 8 to a mile). Compass roses show north and hills are drawn in a way to show if you are travelling up hill or down. The cartouche includes figures surveying and using tools that would have been used to map out the route and recorded the miles.

The wheel on the end of the stick was called a way-wiser that recorded each turn of the wheel on a dial,  while underneath that a winged figure called a Putto is using a Gunter’s chain, invented in 1620, which was laid along the ground to measure distances. The chain measured 66 feet divided into 100 links, ten chains length was a furlong, 80 a mile.  The figure on the horse is holding a compass.

Ogilby died the year after the publication of Britannia, but his work stayed in print, first through the efforts of his step-grandson William Morgan (who like Ogilby was appointed ‘His Majesty’s Cosmographer’), and then through, acknowledged or often not, the works of later cartographers, all making use of such a rich and inventive source of information.

There is one more intriguing chapter to the story. Ogilby was closely allied with Charles II, and there is a theory that Britannia was published to help with a proposed invasion from France to restore the Catholic faith in the country. For some the emphasis that Britannia places in routes to poorly populated ports and locations in Wales and the West Country and the publication date being so close to a signing of a secret treaty with France (so secret it didn’t come into public knowledge till 1820) shows that this was a road map with a hidden agenda, and it is only with this agenda in mind that some of the seemingly random things shown on the maps; a house in the middle of nowhere, mines in one location but not others for instance, begin to make sense.

In the corridor outside the Map Office here at the Bodleian nine portraits are hung. Two are of cartographers; John Speed, the famous Tudor map maker, and John Ogilby, both of whom originally were named in their picture. Ogilby’s name has at some point been painted out, this may be due to changing fashions as none of the other, later, seven portraits name the person in the picture. We can’t be sure though if his name has been erased deliberately, another layer of mystery attached to a man who had more than his fair share throughout his life.

Britannia, volume the first, or, an illustration of the Kingdom of England and Wales by a geographical and historical description of the principal roads thereof…1675. Vet A3 b.10