Category Archives: Bodleian

Sleigh miles

Few people can have more need of a map than Father Christmas. Who else travels the World, at night, visiting every house in every city, town and village? Who else does this but once a year, a long enough gap to forget which turn to take, which lane to go down? Who else makes these journeys on a sleigh drawn by 8 reindeer with no sat-nav, no googlemaps on a smart phone?

To celebrate a cartographic Christmas here’s a selection of map-themed cards collected by map staff at the Bodleian in recent years.


Here’s a card with an old map underlying the Christmas theme, showing the type of map that Santa might have used in days gone by.

Has there ever been a more sampled map than the classic London Underground map? Here’s two cards on the theme


We have Henry Cole to thank for Christmas cards. The first director of what would become the Victoria and Albert Museum commissioned the artist John Callcott Horsley to design the first card in 1843, with a thousand copies printed off and sold under his pseudonym Felix Summerly. Cole was also involved in the setting up of the Penny Post and is credited with designing that most iconic of stamps, the Penny Black. Christmas cards form part of the John Johnson Collection here at the Bodleian, one of the most important collections of ephemera in the World. Find out more about John Johnson, including finding aids, catalogues and blogs here.

A blog on Christmas cards written by the Librarian of the John Johnson Collection Julie Anne Lambert can be found here and more blogs on Christmas ephemera in the collection can be found here .  Amongst the treasures held at the Bodleian are original pieces by J.R.R. Tolkien,  some of the Father Christmas letters that Tolkien sent to his children can be found here and here

There is a lovely map of Santas throughout the World published in the 1950s by the General Drafting Company which can be found here Vintage Map Shows Santa’s Journey Around the World | National Geographic and of course, there’s the famous NORAD tracking Santa site Official NORAD Tracks Santa (noradsanta.org)

Who doesn’t believe? Happy Christmas everyone

Do [not] touch

People have always tried to make sense of their surroundings and plot where they are in the world, often in graphic form. Maps are inherently two dimensional but efforts have been made throughout time to create three-dimensional tactile maps. Primarily they are aimed at visually impaired users but they can also serve to understand relief and the environment in a holistic way. It is unclear when tactile maps started appearing but this lovely example of England and Wales is the earliest in our collections, produced in 1925. It primarily shows relief and rivers but also locates major towns but does not name them.

The development of tactile writing systems really took off in the 19th century with the development of basically embossed versions of roman letters, such as the Moon System but alongside was the use of a logical system of dots representing the letters such as braille.

This globe, which is undated but looks like it was made in the 1960s? uses prominent dots to depict capital cities in Europe but also a chain of mountains in Asia which must be confusing.  You can also see the rivers have been exaggerated and the equator marked to aid orientation.

Tactile maps conventionally were made using thermoforming or vacuum forming which uses heat or a vacuum to fix a material such as plastic or paper over a mould to create a stable physical object. These are very successful but they come with their downside – unlike paper maps they cannot be folded up and put in your pocket. The Royal National Institute for the Blind produced several maps with the Central London map as a typical specimen. With embossed roads and braille labels it is limited in detail so what its purpose is unclear. Was it produced for reference or as a wall map?

What is the future for mapping for blind or visually impaired people? Much work has been done by tech companies with smartphones and hand-held devices. Google Maps can speak directions and even tell you where safe road crossings are while you are using it. Haptic technology is used to generate a hybrid tactile map – for example the signal from your fingers will cause the map to vary when you cross a boundary, such as a road; or come across a symbol, maybe a bank. Although 3D printers can also be used to create maps but do not overcome the portability issue.

The library has a several tactile maps in the collection but this one was particularly challenging as it had no text to identify it. Coming originally from the MOD sample collection it has a red acquisition stamp and a tentative “Torquay” in ball point pen. I could not identify it with a modern map of that area so bit the bullet and tried transliterating the braille labels. It turned out that it needed turning around and it represents the Goswell Road/City Road area of Islington in London!


The Lake District’s topography lends itself very well so this is an attractive example. Designed as a hanging wall map in four sections it has been executed beautifully with using wooden strips glued together which have been sculpted to form the peaks and trough: shorelines, rivers and names have been burnt in to orient the sighted.  Entered into the BCS Awards which not only is it easy on the eye, it has a beautiful feel demonstrating that this is inclusive and appreciated by everyone not only as a map but as original creative piece. The perfect example of aesthetics and technique.


England and Wales. [S.n., S.l.], 1925 C17 (220)

A simplified system of embossed reading for the use of the blind : invented by WIlliam Moon, LL.D. &c. [London] : Moon Society, 1937 Rec. c.185

[World globe in braille]

[Torquay]. [London] : [Royal National Institute for the Blind], [1979] SP 55

Central London. [London] : Royal National Institute for the Blind, 1970. SP 56

Lake District National Park. [Sheffield] : From the Workshop. BCS Awards.

Cartographic detection

Maps recently purchased a large scale manuscript estate map entitled ‘Hen’s Farm in Bordesley in the Paris of Aston in the County of Warwick belonging to Brazen:nose College Oxford, the Free School of Birmingham and Haverford West … Survey’d by [J. Tomlinson, 1761]‘ which is a very nice thing of pen and ink on tracing cloth.

It shows the farm buildings and all the fields associated with it are labelled with areas in acres, roods and perches; individual trees and farm gates are drawn in and the neighbours named.


This was all very well until I came to catalogue it and realised that it only had one unnamed road and no north point making locating it on a modern map pretty much impossible.  Checking our holdings of large scale maps of the area, I still could not place it. I really didn’t want to be beaten at such an early stage so I contacted Brasenose College Archives and Warwickshire County Record Office to enquire if they had any records which would help me place this farm.  Unfortunately, neither of them could help me but Warwickshire suggested I contact Birmingham City Council Archives and Collections.


They, too, did not have any records but helpfully sent me a link to their tithe maps, which have been digitised and crucially, georectified.

For those who are unfamiliar with georectification, it is the process “of taking an image of a map and referencing it to a spatial grid, so that the image of the map can be used as a layer in other maps, or so that the image of the map can in turn be used for associating points of interest with the spatial grid.” This meant they overlaid their maps onto a modern map of Birmingham.

I selected the Bordesley Manor map of 1758 by JohnTomlinson and was immediately struck by the similarity of style to the Hen’s Farm map.

The scale was smaller, the fields weren’t so finely drawn but it was pretty much the same. All I had to do now was find the farm.  After quite a lot of peering through a magnifying glass and an obscure reference in William Hutton’s The history of Birmingham, it was there! I located the farm from the field names, as the buildings are not actually labelled. By removing the tithe map layer, I could see exactly where it was on a modern map. I can report it sat where now is basically the central reservation of the A45 just south of the Tesla Supercharger which doesn’t have quite the same rural idyll feel but useful to know.

https://solo.bodleian.ox.ac.uk/permalink/f/89vilt/oxfaleph022753808

(E) C17:59 (44)

The voyage of the Hero

Admiralty Charts have a reassuring familiarity about them. The Hydrographic Office of the Admiralty first started publishing maps in 1800 and this map from 1860 uses cartographic conventions still in place today. This sense of timelessness comes from the charts concentrating on hydrographic information; soundings, rocks, beacons and so on, features that don’t alter over time. Almost all our cartographic charts in the Bodleian come from legal deposit in pristine condition. I say almost because we do have a number of donated charts as well. What is special about this particular donated map is that it is a chart that has been used, a course has been plotted of a voyage made between July and August of an unspecified year by an unknown ship. A chart used as intended.

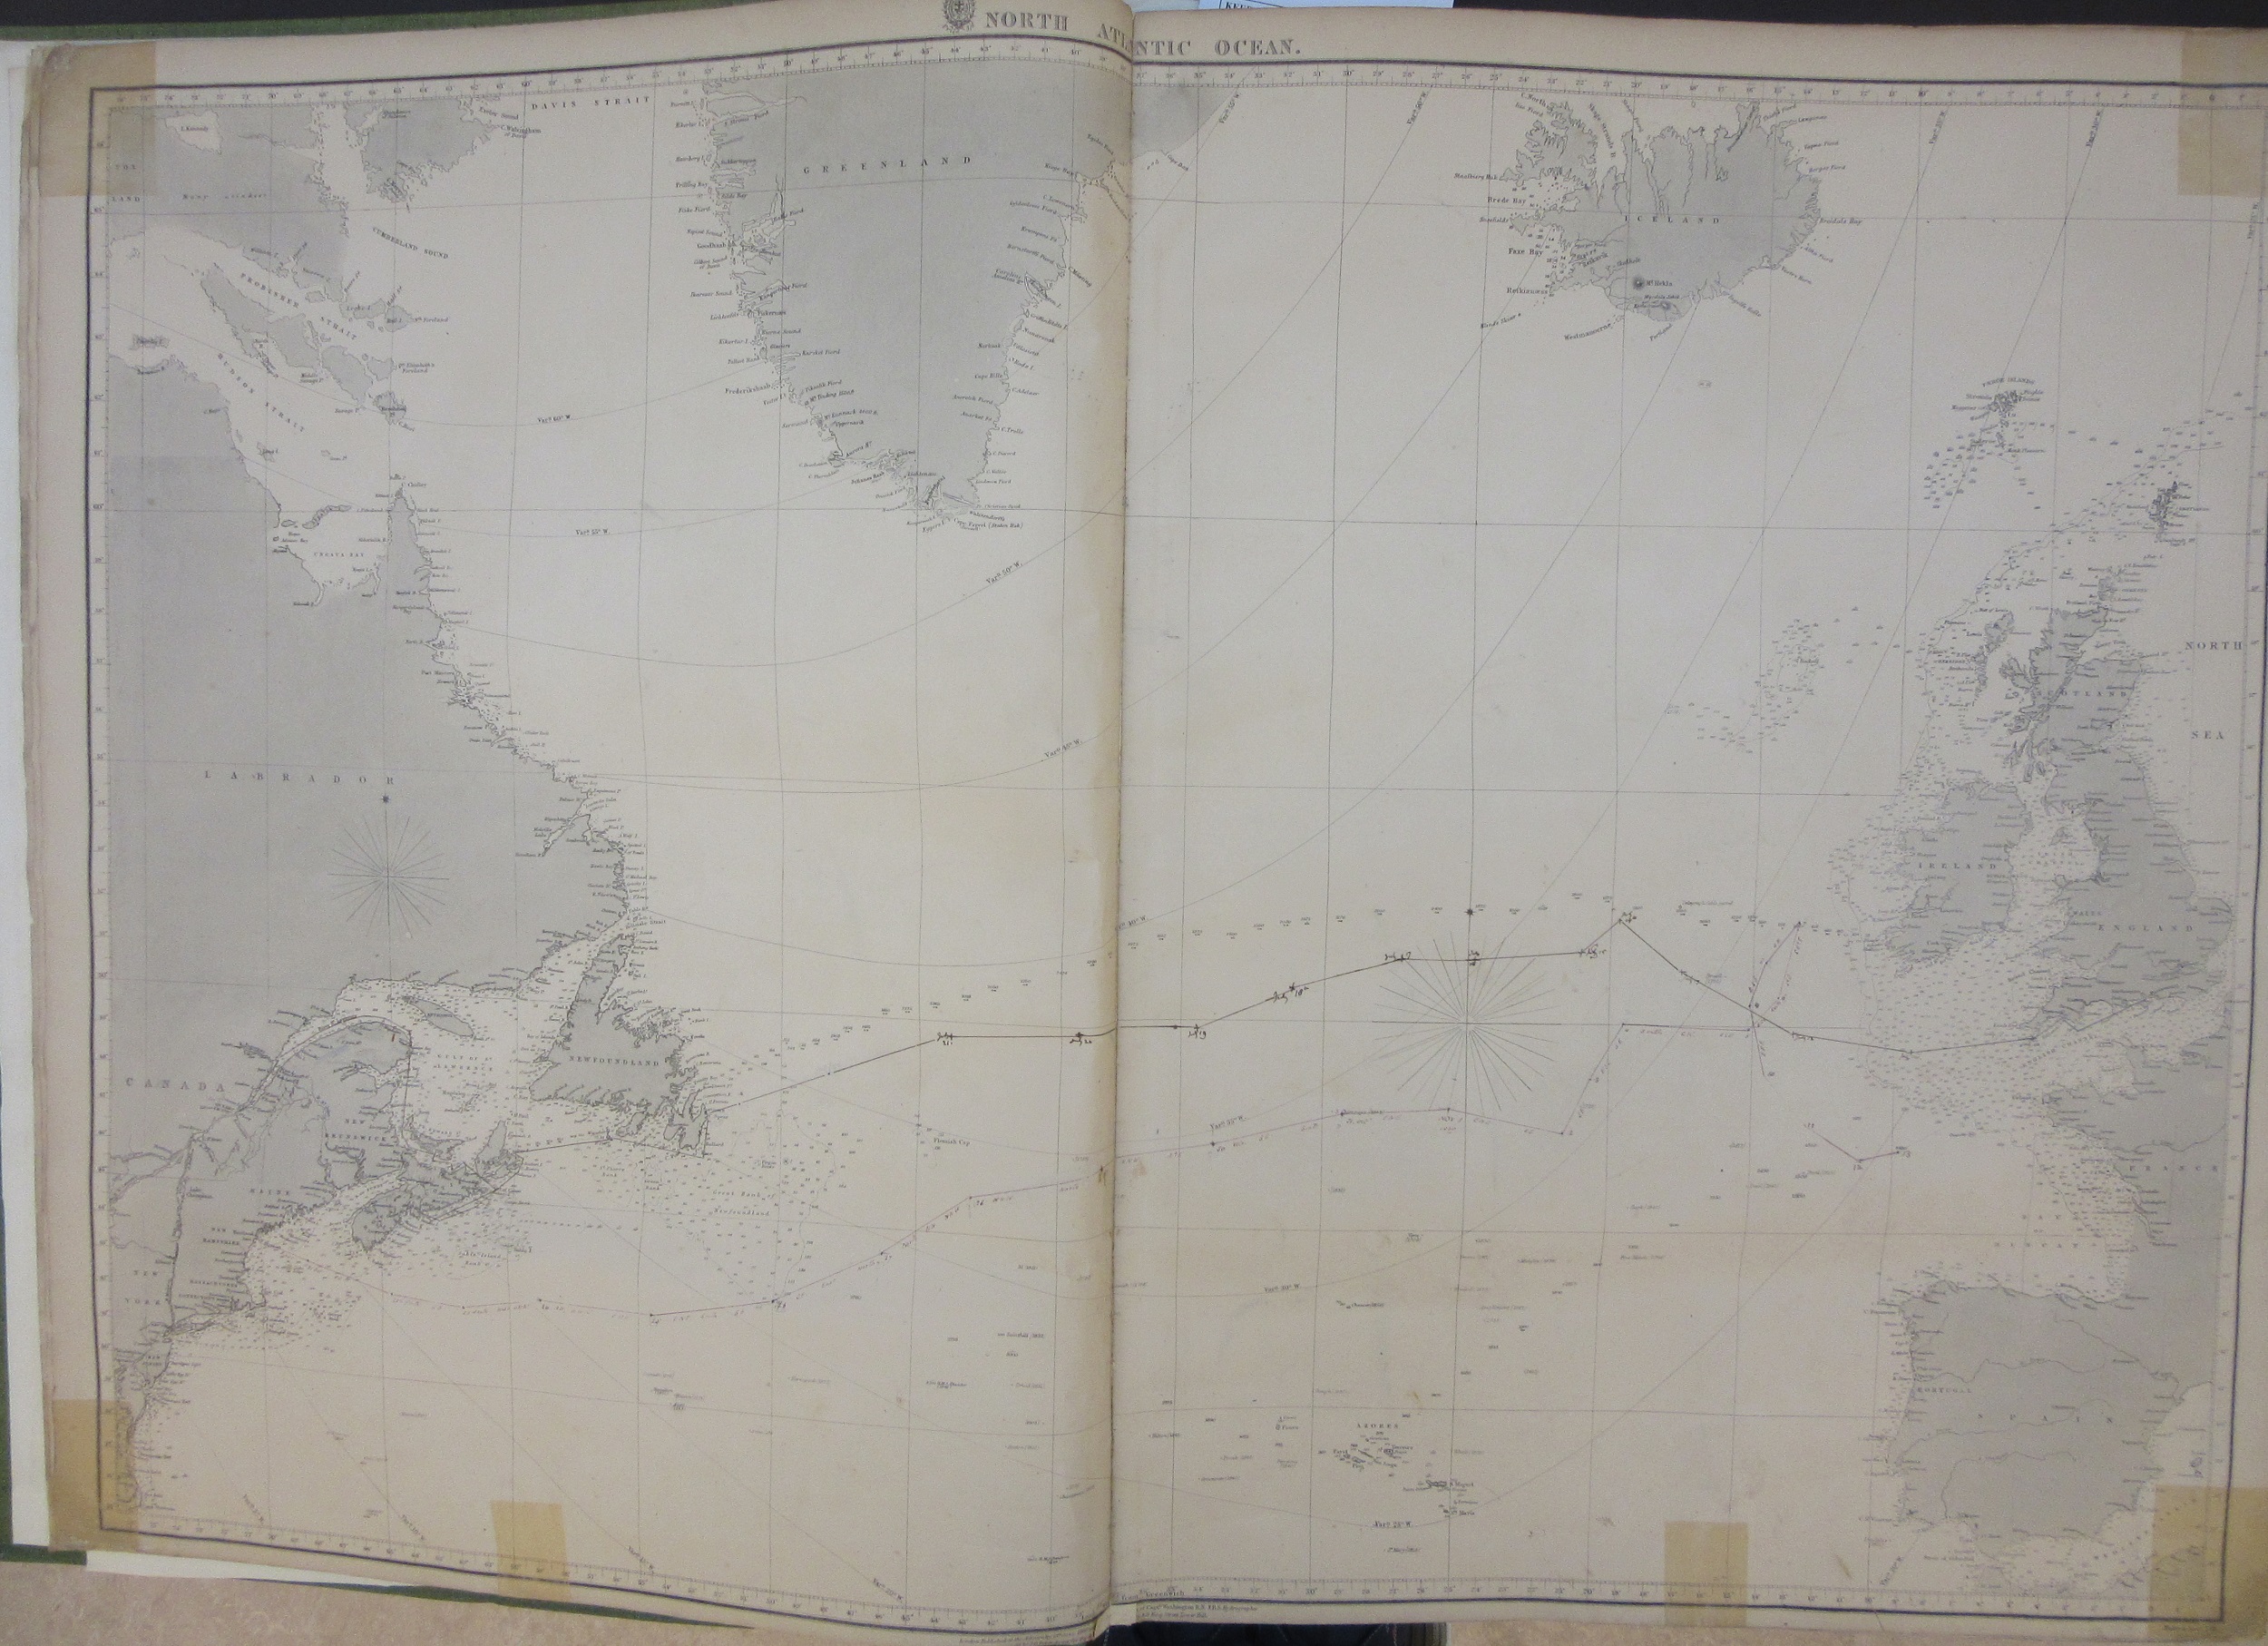
North Atlantic Ocean, published at the Admiralty, 18th June, 1860. B1 a.19

The challenge is to try and discover more about the journey, which really comes down to when and what ship? All we have to go on when looking at the chart is the route, from Southampton across the Atlantic to Quebec, with positions at noon each day from July 10th to August 18th. A seemingly impossible task but there is a clue separate from the map. The chart is one of a number bound up in a volume with the simple title Charts of the Gulf & River St. Lawrence by Capt. H.W. Bayfield, R.N and on the contents page there is a hastily written note in pencil that is the key to the mystery . Sir Henry Acland has a strong connection with Oxford and the Bodleian. Born in Exeter in 1815 Acland became a Fellow of All Souls College and then in 1851 Physician to the Radcliffe Infirmary and Radcliffe Librarian in the Radcliffe Camera which had been, since built, the home of the Radcliffe Science Library. It was during Acland’s time as Librarian that the collection of books moved to a new Radcliffe Science Library and the Camera became part of the Bodleian. This explains Acland’s close relationship with the Bodleian, and the reason why he donated the set of nautical charts to the library in July 1880.

An extract from the chart showing the route taken to Quebec, sailing through the wonderfully named Gut of Canso (also called the Gut of Canseau) between Nova Scotia and Cape Breton Island.

Research into Acland’s life then explains the rest. In 1860 he became physician to H.R.H. the Prince of Wales (who later became Edward VII) just before he went on an official trip to Canada and the United States  onboard H.M.S. Hero, the first time a Prince of Wales had made this journey. The map charts the daily position of the Hero as it voyaged across the Atlantic.

The Gut of Canso (here called Canseau) taken from one of the other charts in the volume. The numbers are soundings while the yellow colours show the positions of lights, which could either be fixed (indicated by the letter F) or revolving (the letter R).

In Oxford Acland is famous for a map made six years before the voyage of the Hero. In 1854 he produced a report on a series of Cholera outbreaks in Oxford which had led to a number of fatalities. It came with a map which highlights the poor sanitary conditions in parts of the city (the areas shaded in green) , the parts of the Thames contaminated and unsafe to drink and the locations where there were cases of Cholera (more on the map can be found here). 

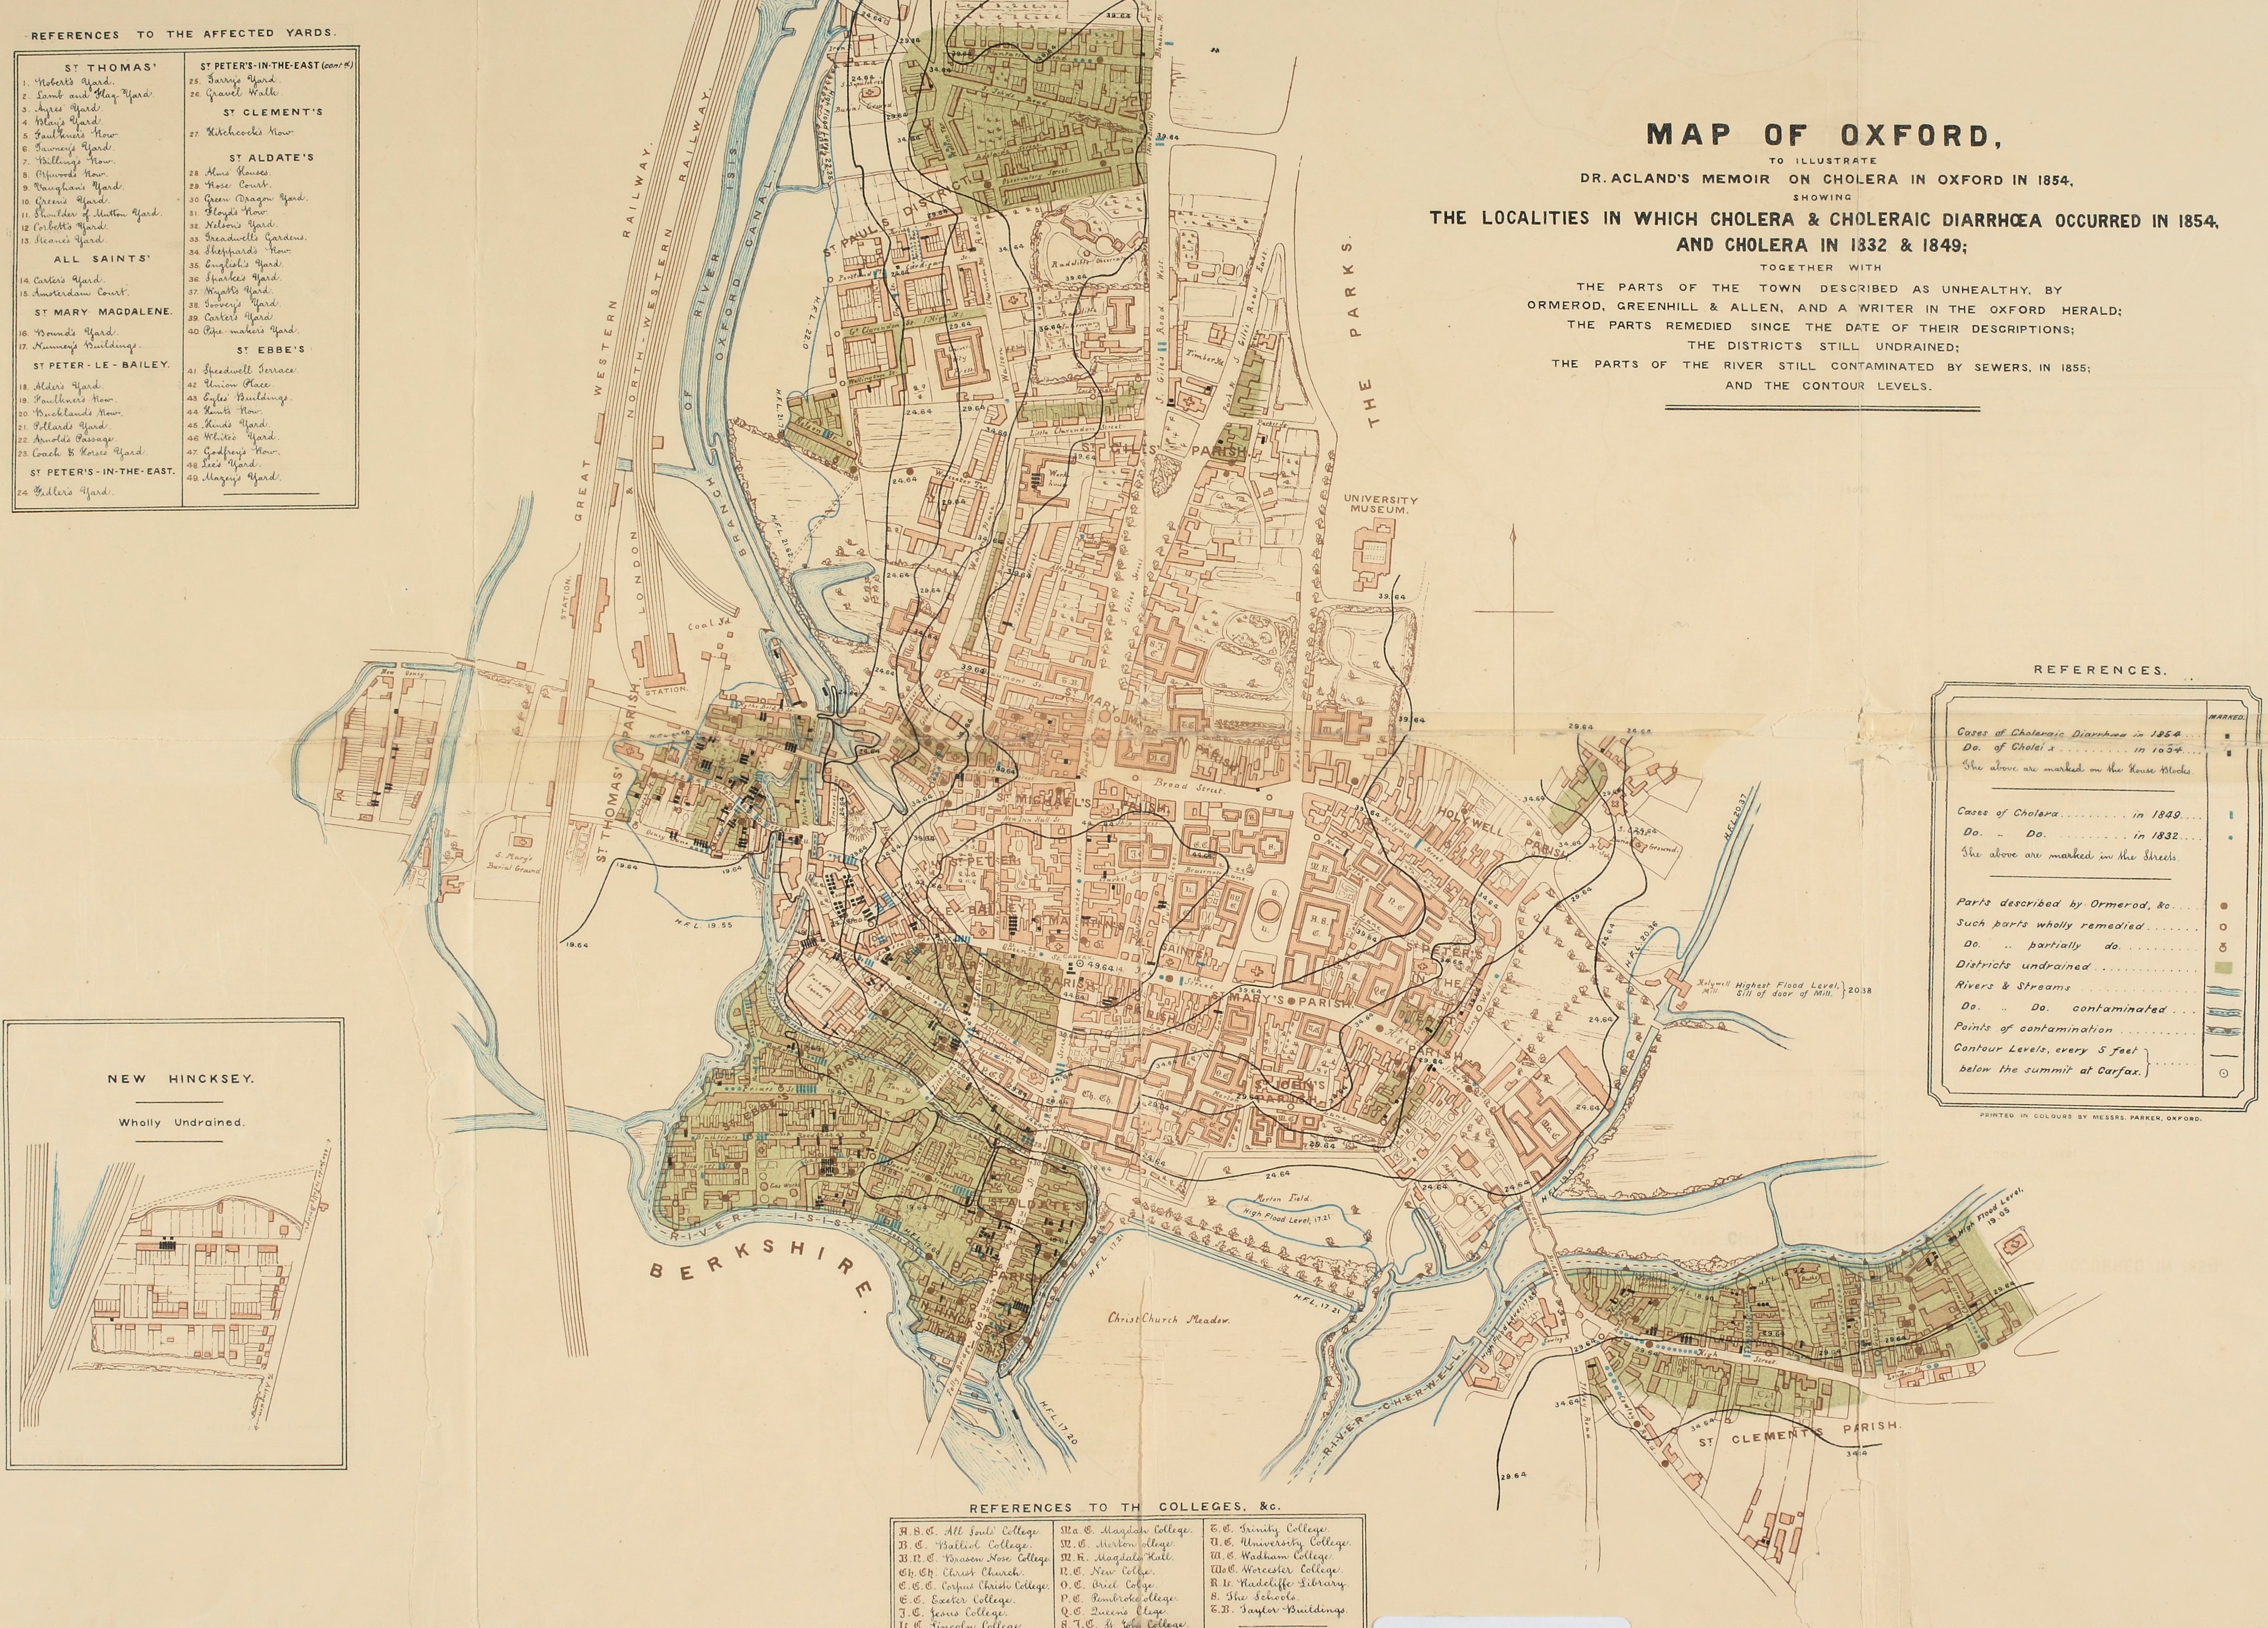
Map of Oxford to illustrate Dr. Acland’s memoir of cholera in Oxford in 1854… 1854. C17:70 Oxford (15)

The Acland Hospital, so long a feature on the Banbury Road in Oxford and now at the Manor Hospital in Headington was built as a memorial to Acland’s wife Sarah. A daughter, also called Sarah, was an early photographer, some of her work can be found in the Museum of the History of Science in Oxford.

In the year after the voyage a book was privately published by Gardner D. Engleheart. ‘Journal of the progress of H.R.H. the Prince of Wales through British North America and his visit to the United States… (203 a.333)’. The book includes illustrations and text about the visit and, helpfully for the purpose of this blog and identifying the map, a log of the journey out giving positions at noon on each day as well as a number of different diary entries from the voyage. So for instance we learn that the Royal Yacht (the Hero) ‘with the Prince Consort sailed at 4 a.m.’, presumably to catch the tide. Then, far more dramatically, from a different diary on the 12th ‘Man overboard! The gun-room steward jumped out of one of the ports, in a fit of temporary insanity, and was drowned! Every effort was made to rescue him, but he would not be saved.’
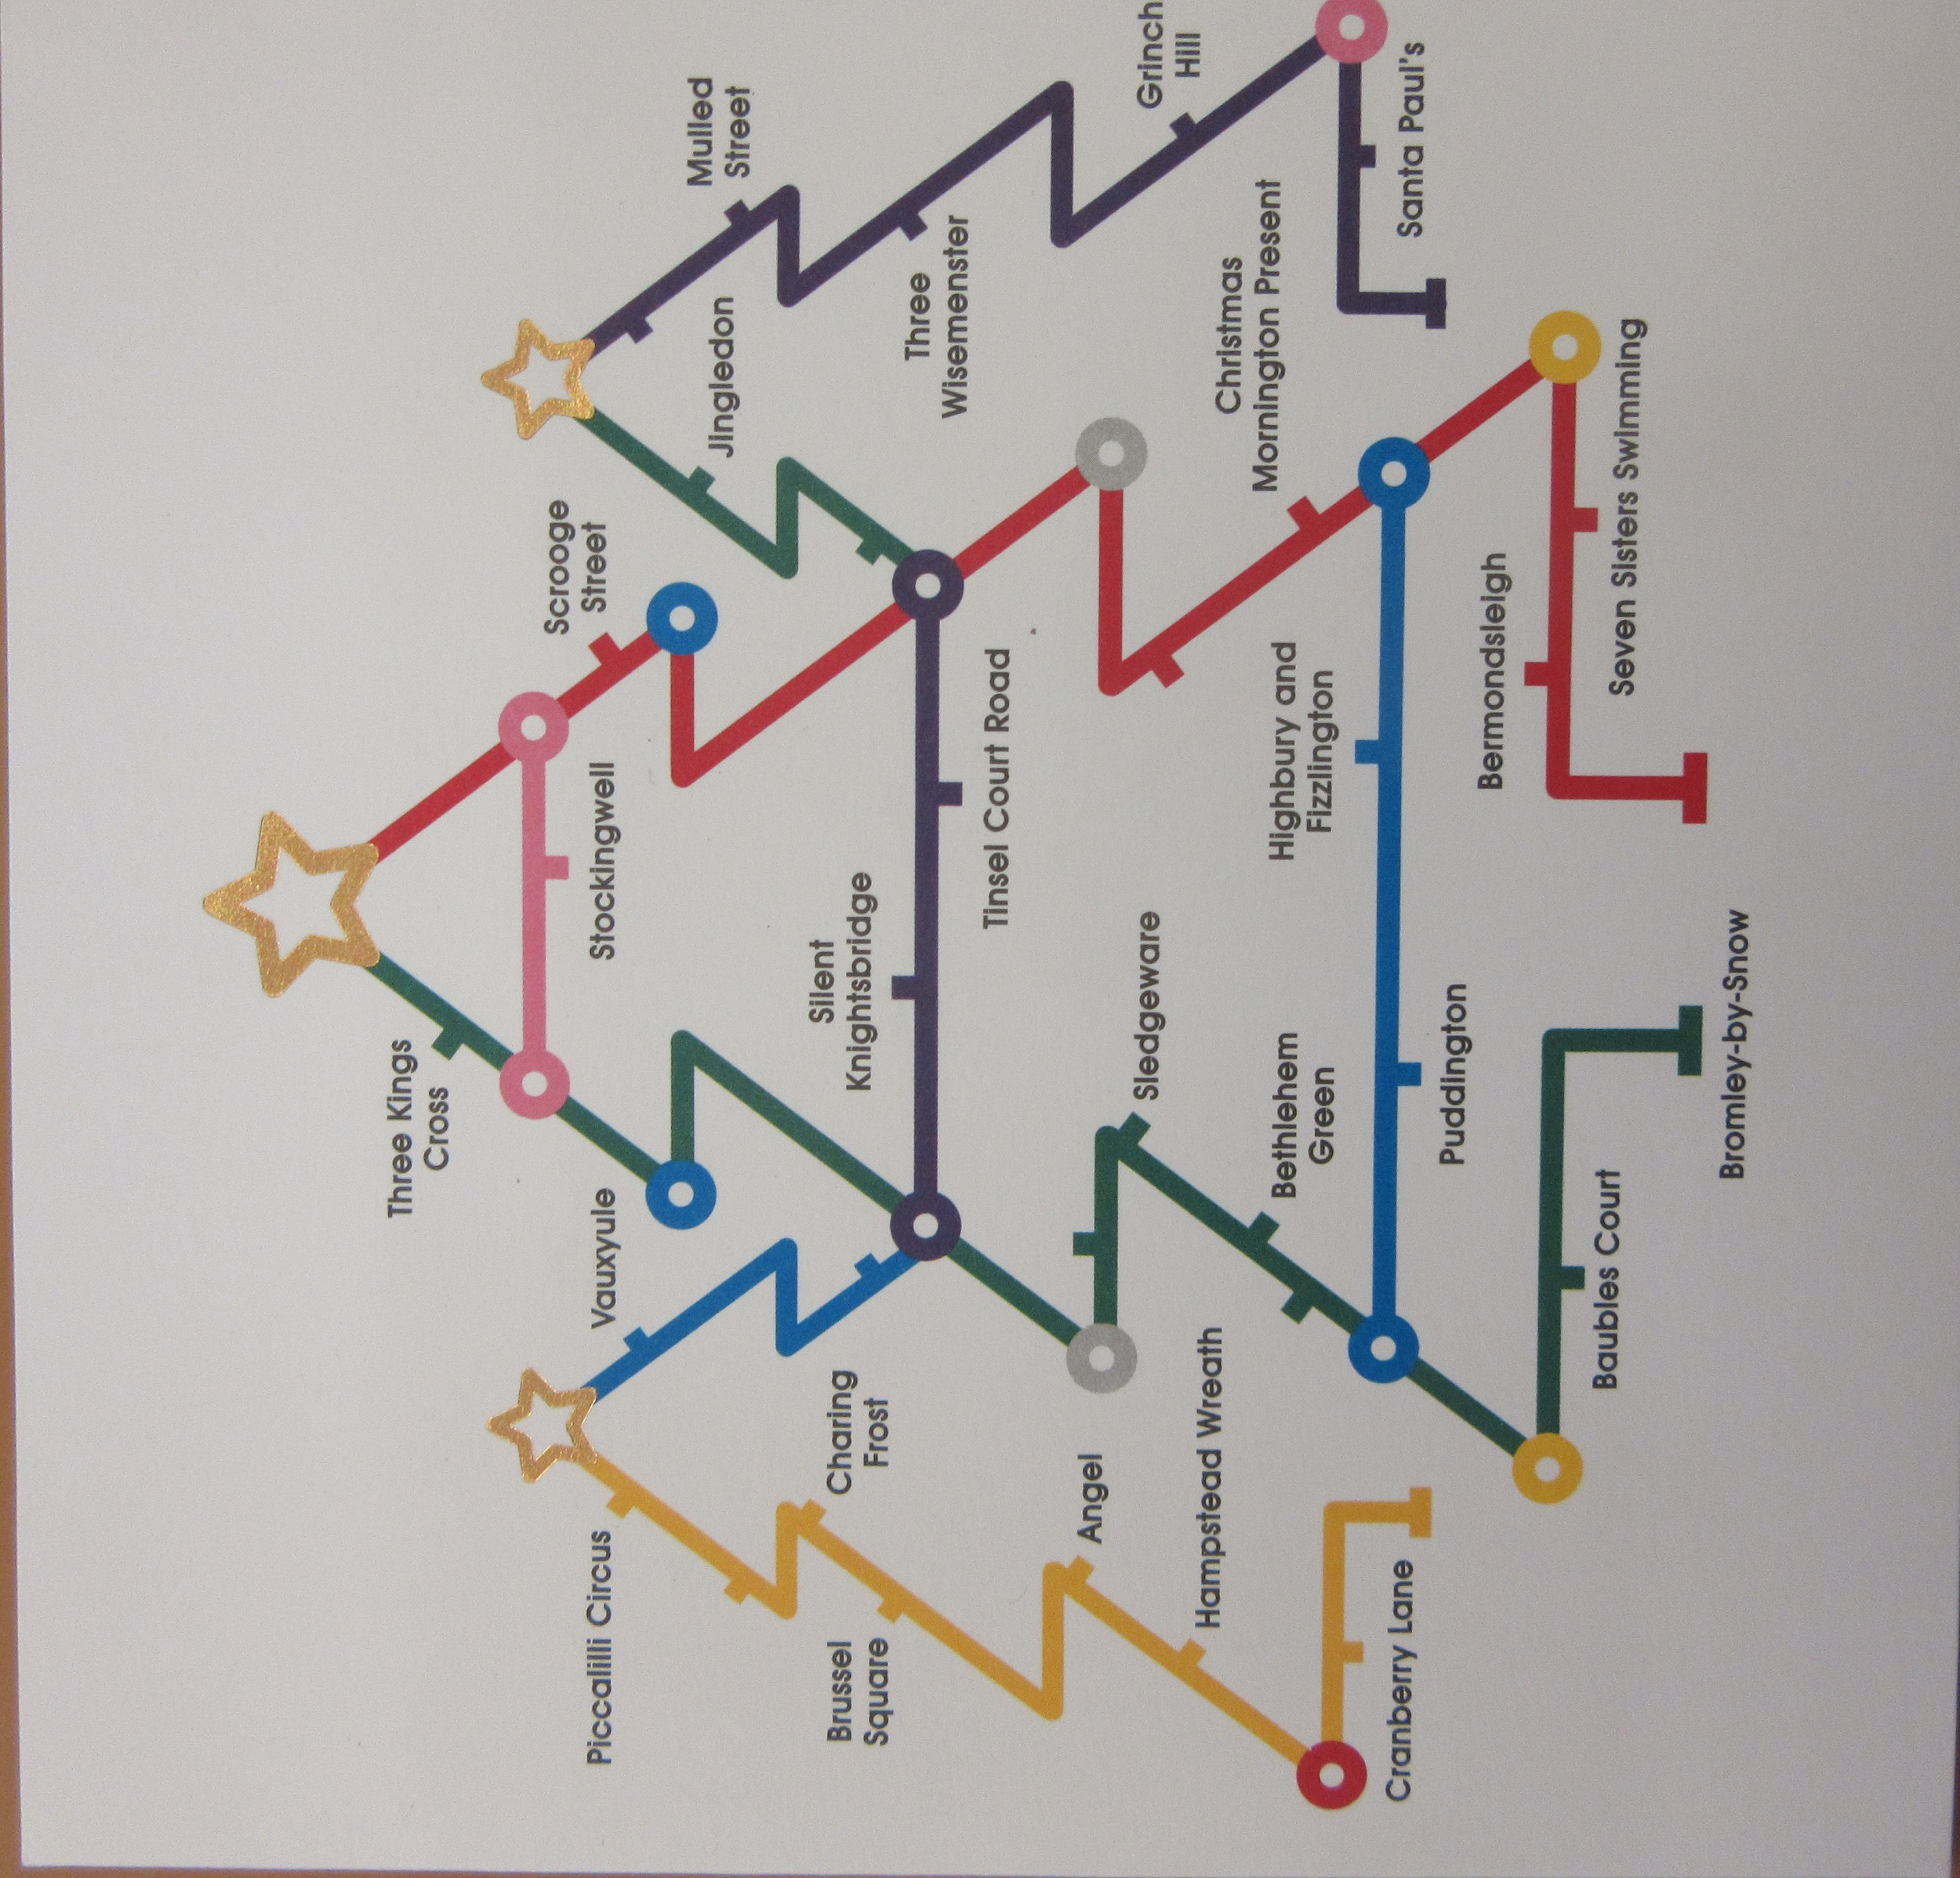
Going South

The early 20th century was the Heroic Age of Antarctic Exploration with the competition between a handful of men really pushing the boundaries of discovery and survey. Ernest Shackleton was at the forefront of this but it wasn’t until after the Nimrod Expedition which he led from 1907 to 1909 that he was able to write about it.

The Expedition, named after the aging ship, Nimrod, was short on funds, lacking experience and preparations were rushed.  Finally the difficulties were overcome and team were underway southwards. The main target was to be the first men to the South Pole. Once the team arrived in Antarctica there were a range of geographical and scientific objectives to be undertaken but there would be long periods of inactivity due to the season and weather. However, Shackleton had put some thought to what the team could do in the long dark winter months.  He took along a printing press with which all the members of the Expedition wrote a book, Aurora Australis.


The challenges of writing, illustration, printing and binding this work in the frigid temperatures cannot be overstated and became the first book published in Antarctica. Published at ‘The Sign of the Penguin’ (Cape Royds) the extreme cold meant the printing ink became thick and difficult to work.  It can be imagined that to include maps in this work would just be too difficult. However, about one hundred of these volumes were produced and bound by another expedition member, Bernard Day, using recycled horse harnesses and Venesta boards from the packing cases.

Each copy retains stenciling indicating the provisions packed in that case which gives each copy a name.  The lettering on the Bodleian’s copy is “Kidneys”.

An Australian member of Nimrod Expedition, Douglas Mawson, created the maps of the expedition from surveys he and other members undertook. A geologist at the University of Adelaide by profession, he was ideally placed to do this work.

The maps show the Expedition’s Winter Quarters at McMurdo Sound, Cape Royds, and their routes on land and ice.  The style of the maps is attractively spare but almost illustrative. Printed in colour, the depiction of relief is mainly pictorially stippled with the names of the features are a mixture between prosaic (Brown Island, Snow Valley) and commemorational such as Mount Evans, Mount Doorly, both named by Captain Scott during the earlier Discovery Expedition after colleagues. Also notice the Royal Society Range – it’s always good to keep your sponsors onside. The routes show the first ever ascent of Mount Erebus, the second highest volcano in Antarctica, and the route southwards. It is poignant that the route stops not at the South Pole but at the map edge, dated “16.1.09 Lat. 72° 25’ Long. 155° 16’.”. However, this was the furthest south anyone had reached at that time.


The maps were drawn once the party returned to England and were issued in The heart of the Antarctica by Ernest Shackleton which was published in 1909 as a weighty two volume work.

The heart of the Antarctic  2036 d.17,18

Aurora Australis Broxb. 51.14

Treasure Unearthed!

Treasure Unearthed!

Shelf checking a printed book collection I came upon an uncatalogued atlas which looked very interesting.  Although it had engraved and letterpress title pages for Visscher’s Atlas Minor it was, in fact an atlas factice of mainly seventeenth century maps from atlases of various publishers. It is contained in the Bodleian’s collection of books belonging to John Locke (1632-1704), philosopher and influential Enlightenment figure.

Locke was awarded his master’s degree from Christ Church, Oxford in 1658 and developed into polymath and in 1668 was elected as a Fellow of the Royal Society but his interests also covered amongst others medicine, political theory and religious tolerance and influenced by Bacon, Descartes and Hobbes.  Throughout his life he wrote and disseminated his ideas on this range of subjects so it is no surprise that he would have amassed a collection of maps.


After his death in 1704, his library was left to his cousin Peter King, later Lord King when in 1947 the Bodleian bought some of the books and manuscripts. The remainder were found at Ben Damph Forest, the seat of the Earl of Lovelace (as Lord King later became) and were later bought by Paul Mellon who then presented this collection to the Bodleian in 1978.


The volume itself contains 48 maps, charts and plans produced and published by the leading cartographers contemporary with Locke, so along with Visscher, Frederik de Wit, Carel Allard and Peter Schenk also featured.  Additionally included is an ephemerides by Jean Baptiste Coignard which would have sat well with the maps. Map number 15 A New Chart of the Sea Coasts Between England and Ireland by Richard Mount is uncommon and unusually oriented with west at the top.

The binding is the original vellum with blind stamped border and corner pieces; and large ornament with evidence of ties. There is a spine title in manuscript (Locke?) Visscher Atlas. There is a circular red morocco bookplate with a gilt image of stook of corn and lettering “Oak Spring, Paul Mellon” indicating its later provenance.


Atlas factice of mainly Dutch 17th century maps  Locke 22.1

Rummaging through virtual maps

Over the past 4 months, the Map Room staff have, like so many others, been working from home. Away from our physical map collection, what have we been doing?

Cataloguing staff are working on a project to to index a large collection of digital scans. Thousands of our maps have been scanned to provide images for research purposes, but we don’t yet have a complete list to show which scan number corresponds to which map. The scans include a huge variety of different maps. There are loose sheets from the Gough Maps collection covering the British Isles, trench maps from WWI, maps from the Commonwealth and African Collections, early atlases from the Allen collection, and around 3000 maps with an (E) shelfmark – sheet maps dating from before 1850, for places all over the world. The latter include beautiful early printed maps (such as the view of Toledo in Spain by Braun and Hogenberg above) and maps made for practical purposes (the second image is from the report for the Bog Commission in Ireland, published in 1814).

There are a small number of manuscript maps as well, such as this sketch of the Kusasi region in northern Ghana, from the Commonwealth and African Collections. It was made in 1927 and shows the area divided into tribal regions; a published map based on this one was produced in Accra the following year. Its condition suggests that it was very much a working document.

A big positive for those involved has been the opportunity to look at images of these interesting, varied and often beautiful maps from our collections. It’s the virtual equivalent of spending days rummaging through the drawers (which we wouldn’t usually have time to do!) This should be the first step towards adding many of these images to the Digital Bodleian collection.

The bogs on the rivers Laune and Lower Maine in Kerry / by. A. Nimmo. J. Basire sculp. From the 4th report of the Commission on the Bogs in Ireland. London: House of Commons, 1814.  (E) C19 (204)

Toletum. Cologne : Georg Braun, 1593. (E) C38 (167)

Sketch map of the Kusasi District, Gold Coast. Signed by C. St B. Shields, 12.12.27. 722.11 t.1 (25).

Treasures from the Map Room

Staff at the Bodleian and other specialists have written a book, Treasures from the Map Room, which has essays on 75  maps from the collection. They include historically important maps, interesting quirky ones and some of our personal favourites. From the Gough Map of 1370 to the map created by the artist Layla Curtis for the NewcastleGateshead Festival of the Visual Arts in 2006 the book shows the range of material held in the Bodleian’s collections, and includes maps hand-drawn by J.R.R. Tolkien, C.S. Lewis and General Gordon, beautifully illustrated Venetian portolans, military and scientific mapping as well as cartographic works of art. We feature here one of the maps from the book, which is published today.

 5A ptol_for_blog_smaller

This woodcut world map, published in Ulm in 1486 and based on much earlier information, has an intriguing link with the European discovery of the Americas. The map data comes from Claudius Ptolemy (fl. 146-c.170), who composed his Geographia in Alexandria in ca. 160 AD. He provided coordinates for 8000 places, tied­ into a grid of longitudes and latitudes; an extraordinary achievement for the time. It is not known if he ever made the maps his work describes, but the text survived in Arabic manuscripts as a set of instructions for making maps of the known world. In the early fifteenth century it was translated into Latin by ­Jacopo d’Angelo;   the ­maps were­ later revised by Nicolaus Germanus (fl. 1451-1456), a German Benedictine. He aimed to follow­ Ptolemy’s instructions and his maps must be close to those ­Ptolemy himself might have compiled. Ptolemaic atlases are amongst the earliest printed books.  A version with the maps engraved on copper was produced in 1478, but this woodcut version has a unique charm.

This copy belonged to King Ferdinand and Queen­ Isabella of Spain, whose coat of arms is in the book.  Ferdinand and Isabella supported Columbus’ voyage across the Atlantic. Although Ptolemy’s locations were amazingly accurate for their time, his calculation of the Earth’s circumference was an underestimate.  Columbus (who owned a 1478 edition of the Geographia) believed the distance to China to be less than it was, based partly on this. As Ptolemy’s geography demonstrates, the understanding that the world was round was nothing new even in Columbus’s day. But this world map raises intriguing questions. Would Columbus have planned to travel west to China, and encountered the Americas on the way, without this misconception? Would Ferdinand and Isabella have been so supportive if they had not also owned a copy of the book that supported his theory?

‘Typus orbis terrarum’ from the ‘Geographia’, by Claudius Ptolemaeus Alexandrinus, trans. Jacobus Angeli, ed. Nicolaus Germanus. Ulm: Johann Reger, for Justus de Albano, 21 July 1486; with the maps from the edition of ­Ulm, Lienhart Holl, 1482. Arch. B b.19 (Bod-inc. P-529 (2))

The full article is in Treasures from the Map Room: a journey through the Bodleian collections. Oxford: Bodleian Library, 2016. ISBN 978 1 85124 250 4. Available from the Bodleian bookshop.

River Thames from its source to the sea

A recently purchased map arrived in the Map Room this week for us IMG_0041all to pore over.  The River Thames from its source to the sea was produced at a time when the Thames was enjoying an explosion of interest as a source of leisure.  Small boats were available for hire at towns such as Oxford, Reading and Windsor, locations which were now conveniently in reach of the railway travelling public.


This beautifully executed map was compiled and engraved by Edward Weller to be issued as an insert to the popular newspaper the Weekly Dispatch and subsequently included in The Dispatch Atlas published early in 1863. It is the first state of nine states which were finally produced in the next thirty six years. Weller was one of the first to produce maps using lithography, a cheaper method of production than the more traditional intaglio printing.  After his death in 1884 these steel plates were acquired by the firm of Cassell, Petter and Galpin. The Cassell’s Complete Atlas was issued in 1865, and as Cassell’s British Atlas with the addition of statistical information.016


The map shows the whole length of the river from the Thames Head, marked, west ofCirencester to the estuarine mud flats at Southend, in three strip maps at a scale of half and inch to 1 mile (1:126,720).  The minimal but precise hand colouring of just the county outlines is still bright and adds definition to the map without taking away from the very fine detail.  The railways, including the recently built Epsom line are shown by double cross hatched lines.

IMG_0042

The River Thames from its source to the sea. London : Weekly Dispatch Atlas [1863] C17:8 (380)


History of the Map Room

While maps and atlases have come into the library from its earliest days the map collection began in earnest in 1800, following a decision made to start the purchase of English and Foreign maps. In 1813 the Curators of the library ordered a large table to be made to hold the increasing collection of maps and atlases, which had grown in size with the bequest in 1809 of the collection of Richard Gough, which included the world famous map of Britain, the ‘Gough Map’, dating from the 1370s and the earliest map in existence showing a road network.

449x222_GoughMap

The main part of the collection though has been, from the start, the printed maps of the Ordnance Survey, published from 1801 onwards and which comes into the library under the legal deposit arrangement of 1610. This was followed in the second half of the nineteenth century by the hydrographic charts published by the Admiralty, and by 1882 it was reckoned that the library was receiving between three and four thousand sheets a year from these two organizations alone.

For many years the collection was held in the Douce Room (now part of the Lower Reading Room) where it was felt that ‘In default of means of dealing with them and of space for their storage, maps, it is to be feared, were regard as an encumbrance’. (1)

The collection moved from the Douce Room in 1887, into the Moral Philosophy School room in the Old Schools quadrangle. Fitted out at a cost of £480 this space was soon cramped and it wasn’t until the completion of the New Library in 1939, and with it a large purpose-built room on the east side of the building with storage areas set aside in the stacks on the same floor that the Map Department had finally a proper home.

Increased storage in the New Bodleian bookstack was soon put to good use. Throughout the Second World War and after the library has been fortunate in receiving from the Geographical Section of the War Office, and more recently the Ministry of Defence, a large number of maps from both the Allies and Axis forces, giving the Bodleian not only maps of historical interest but also detailed mapping of parts of the world that the library had poor cover of up until the arrival of these donations.

Bodley’s map collection was held in the New Library until 2010 when, along with all the other material held by the library, the maps, atlases and globes moved to purpose-built accommodation in Swindon. With over a million maps to call on the collection is stored in a controlled environment in drawers with space to let the collection grow, through material published in Great Britain that comes to the library via the legal deposit agreement of 1610 and the large number of donations the Bodleian receives each year. While the Ordnance Survey continues to be the make up a great part of the collection donations from the Ministry of Defence means the library has a large amount of material dealing with Britain’s military and colonial past, from trench maps from the western front to tribal maps of Africa.

  1. Craster, E. History of the Bodleian Library 1845-1945, 1952. Pg 81, X1.11.