Category Archives: Ordnance Survey

As if we were never there

The different levels of mapping produced by the Ordnance Survey is astonishing. The Landranger and Explorer maps we buy in the shops are the tip of an iceberg that currently includes maps on Roman, Prehistoric and Civil War Britain, maps designed for children as well as a complete online digital service,  while in the past the OS has published military, geological and administrative mapping as well as commercial maps for travellers and tourists. Amongst all these variations of themes and scales there is one set of maps that are contrary to what we imagine the purpose of map is. We expect a map to show the means to plan a journey, or a holiday or walk. In the 1930s a series of maps appeared that defied these expectations, maps that showed a land devoid of any human interference. Free of buildings, towns, cities and any transport infrastructure these maps show a landscape not seen for thousands of years.

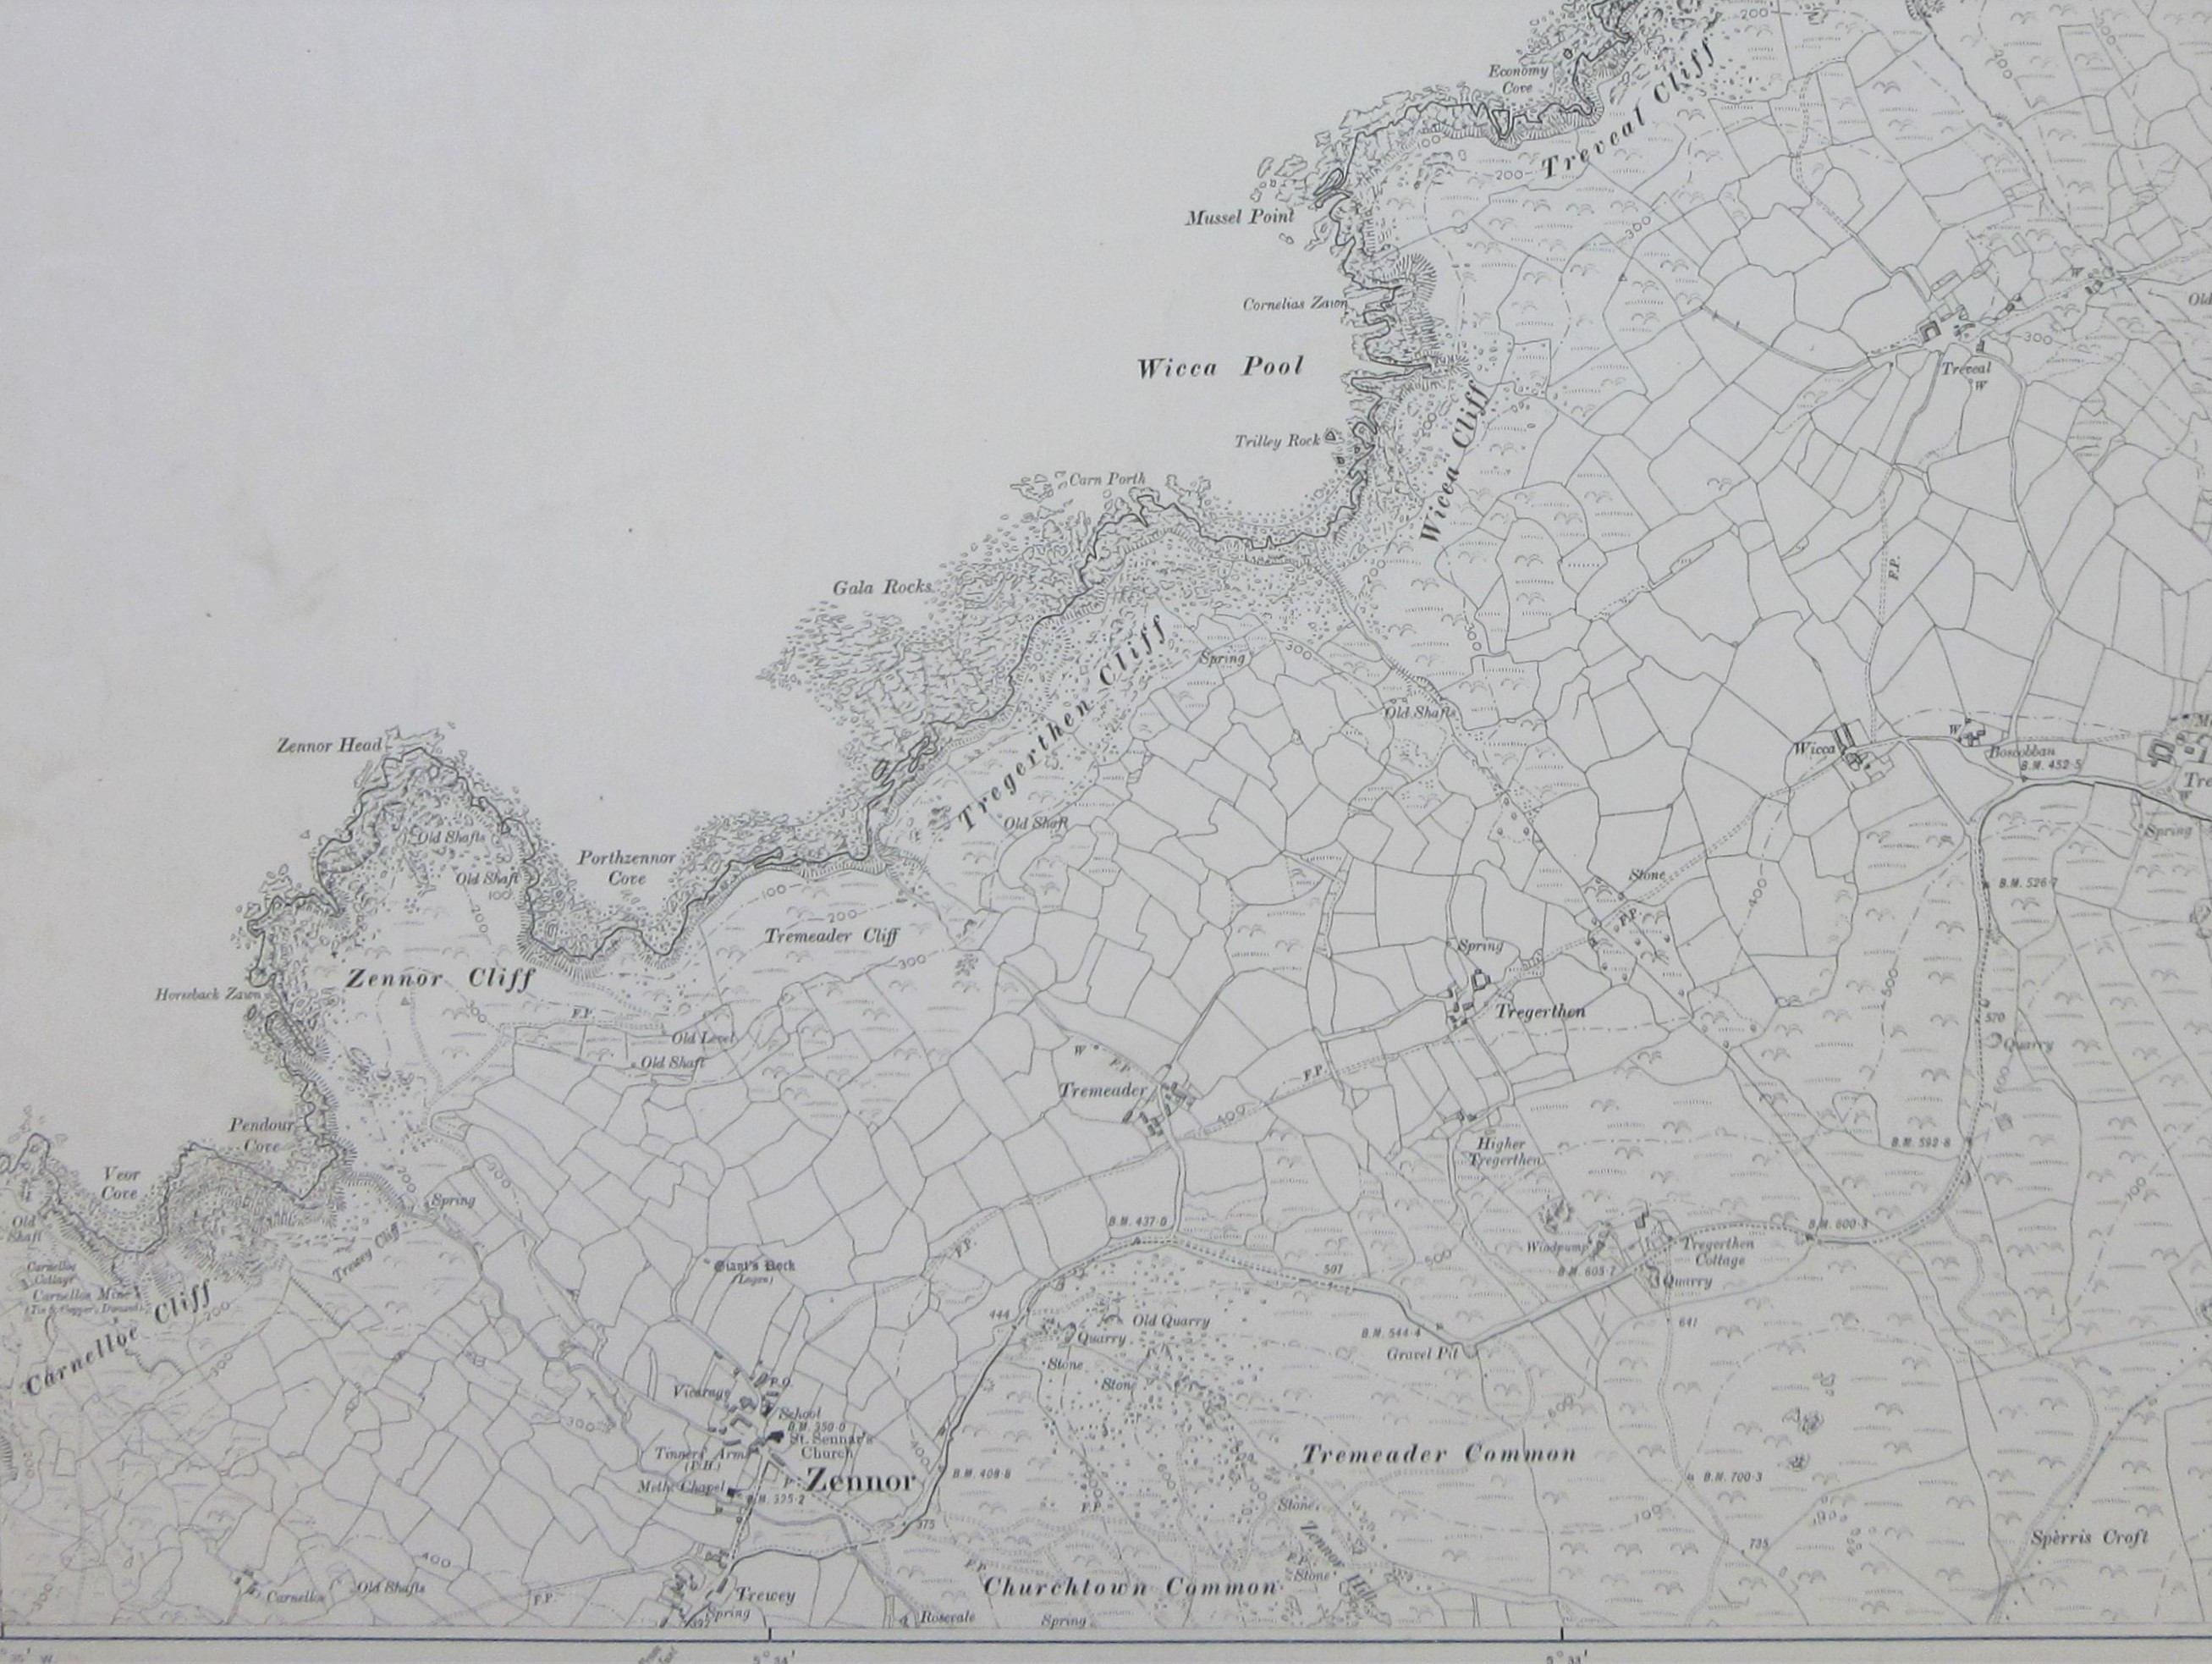
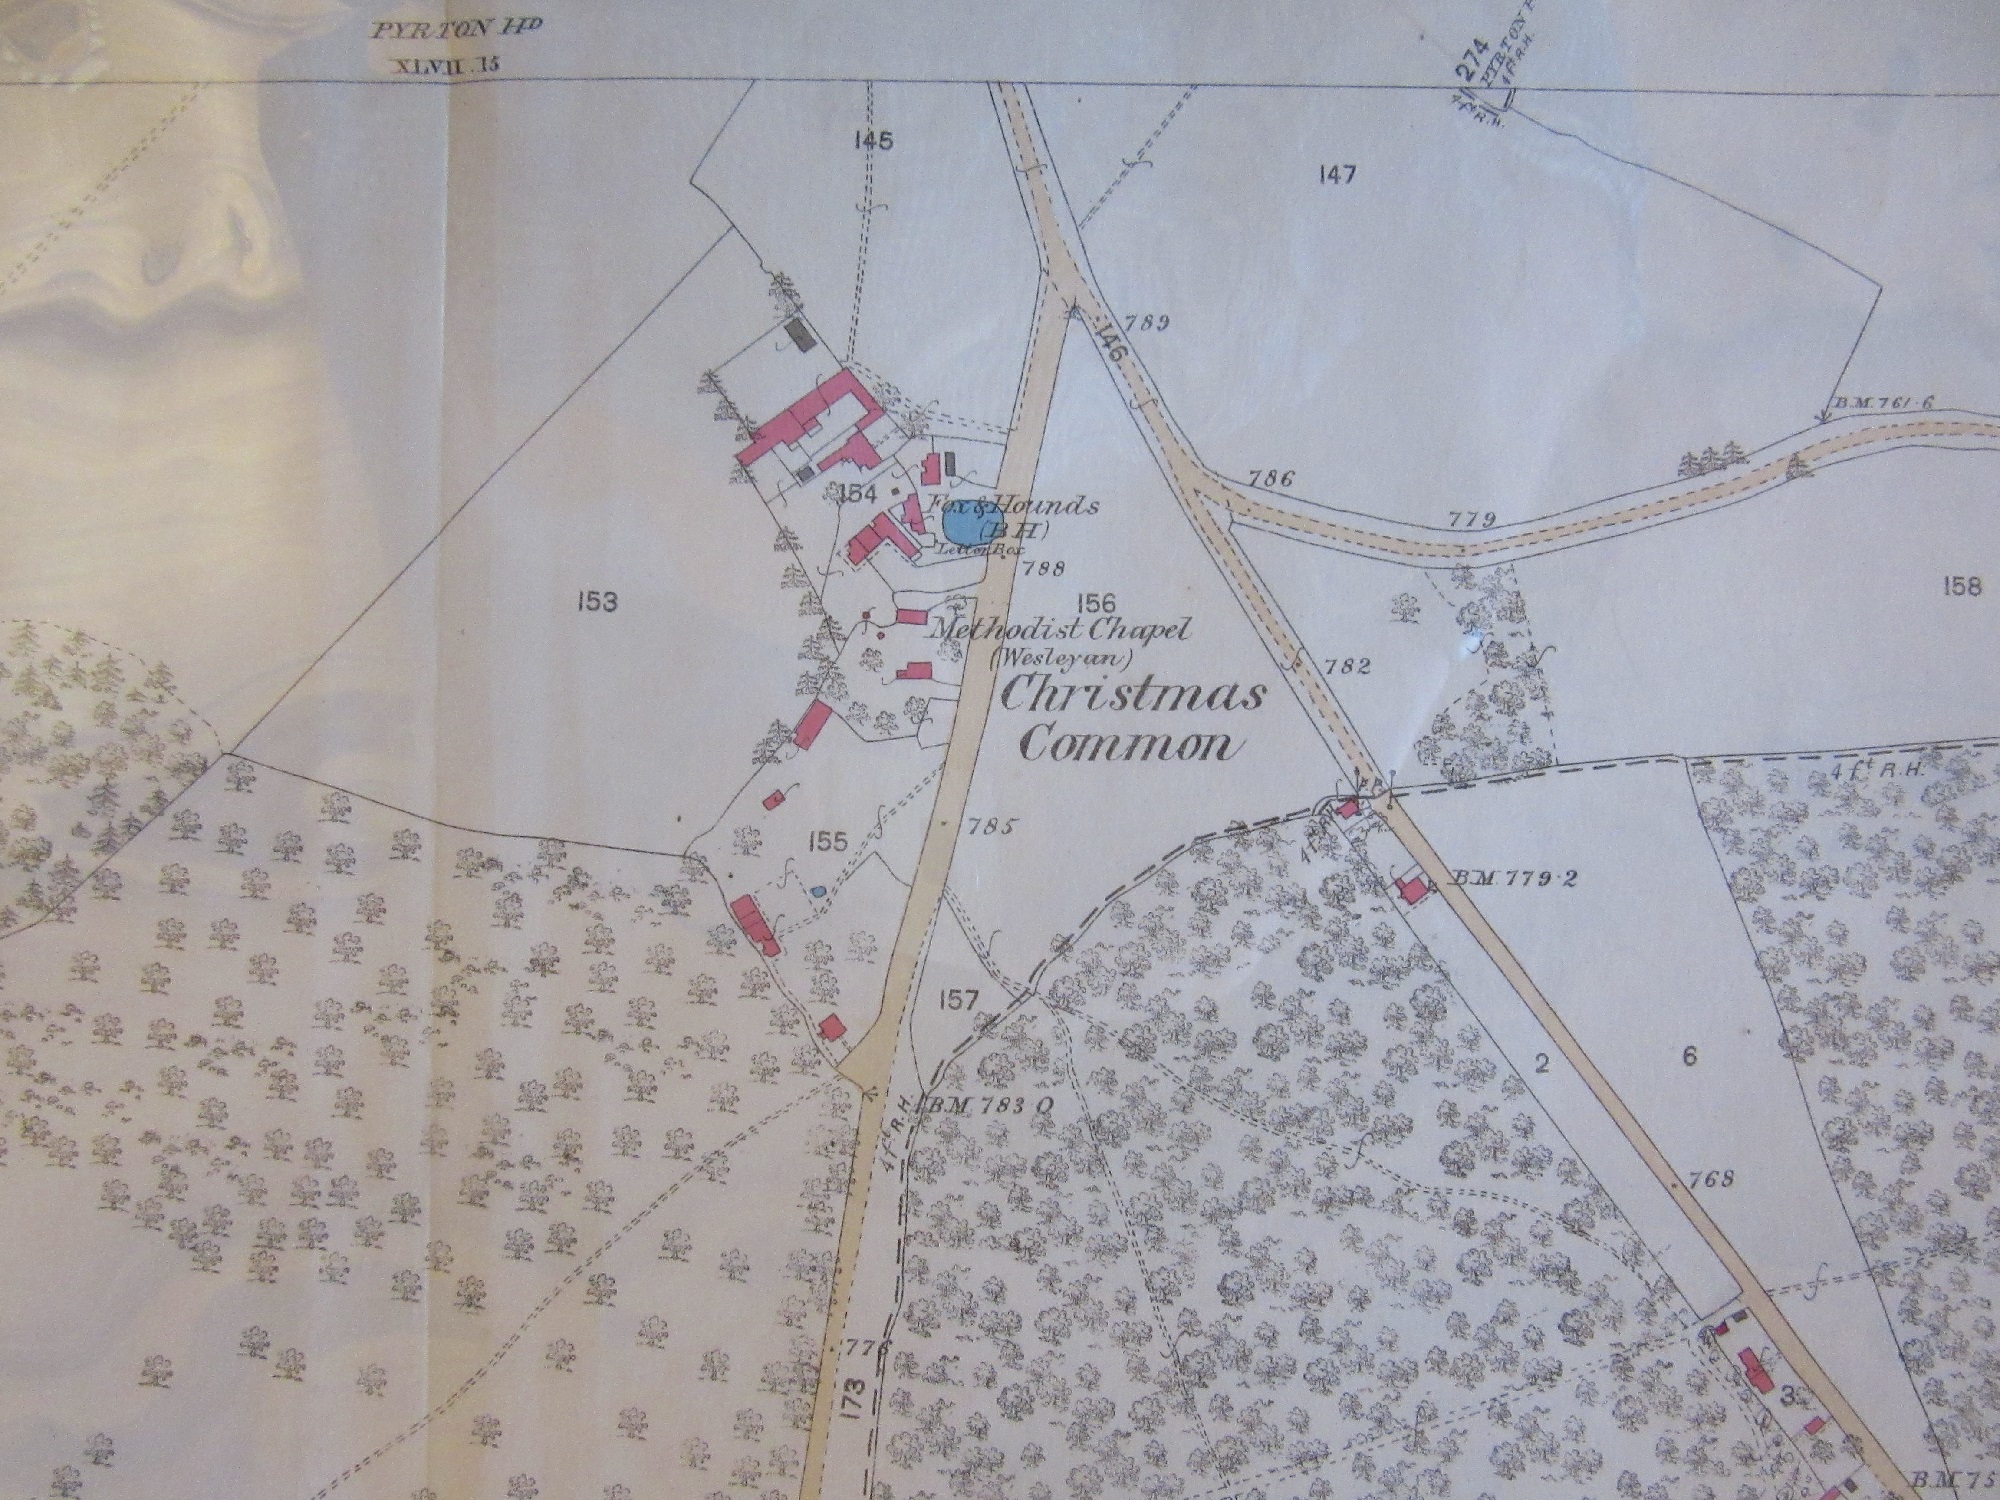
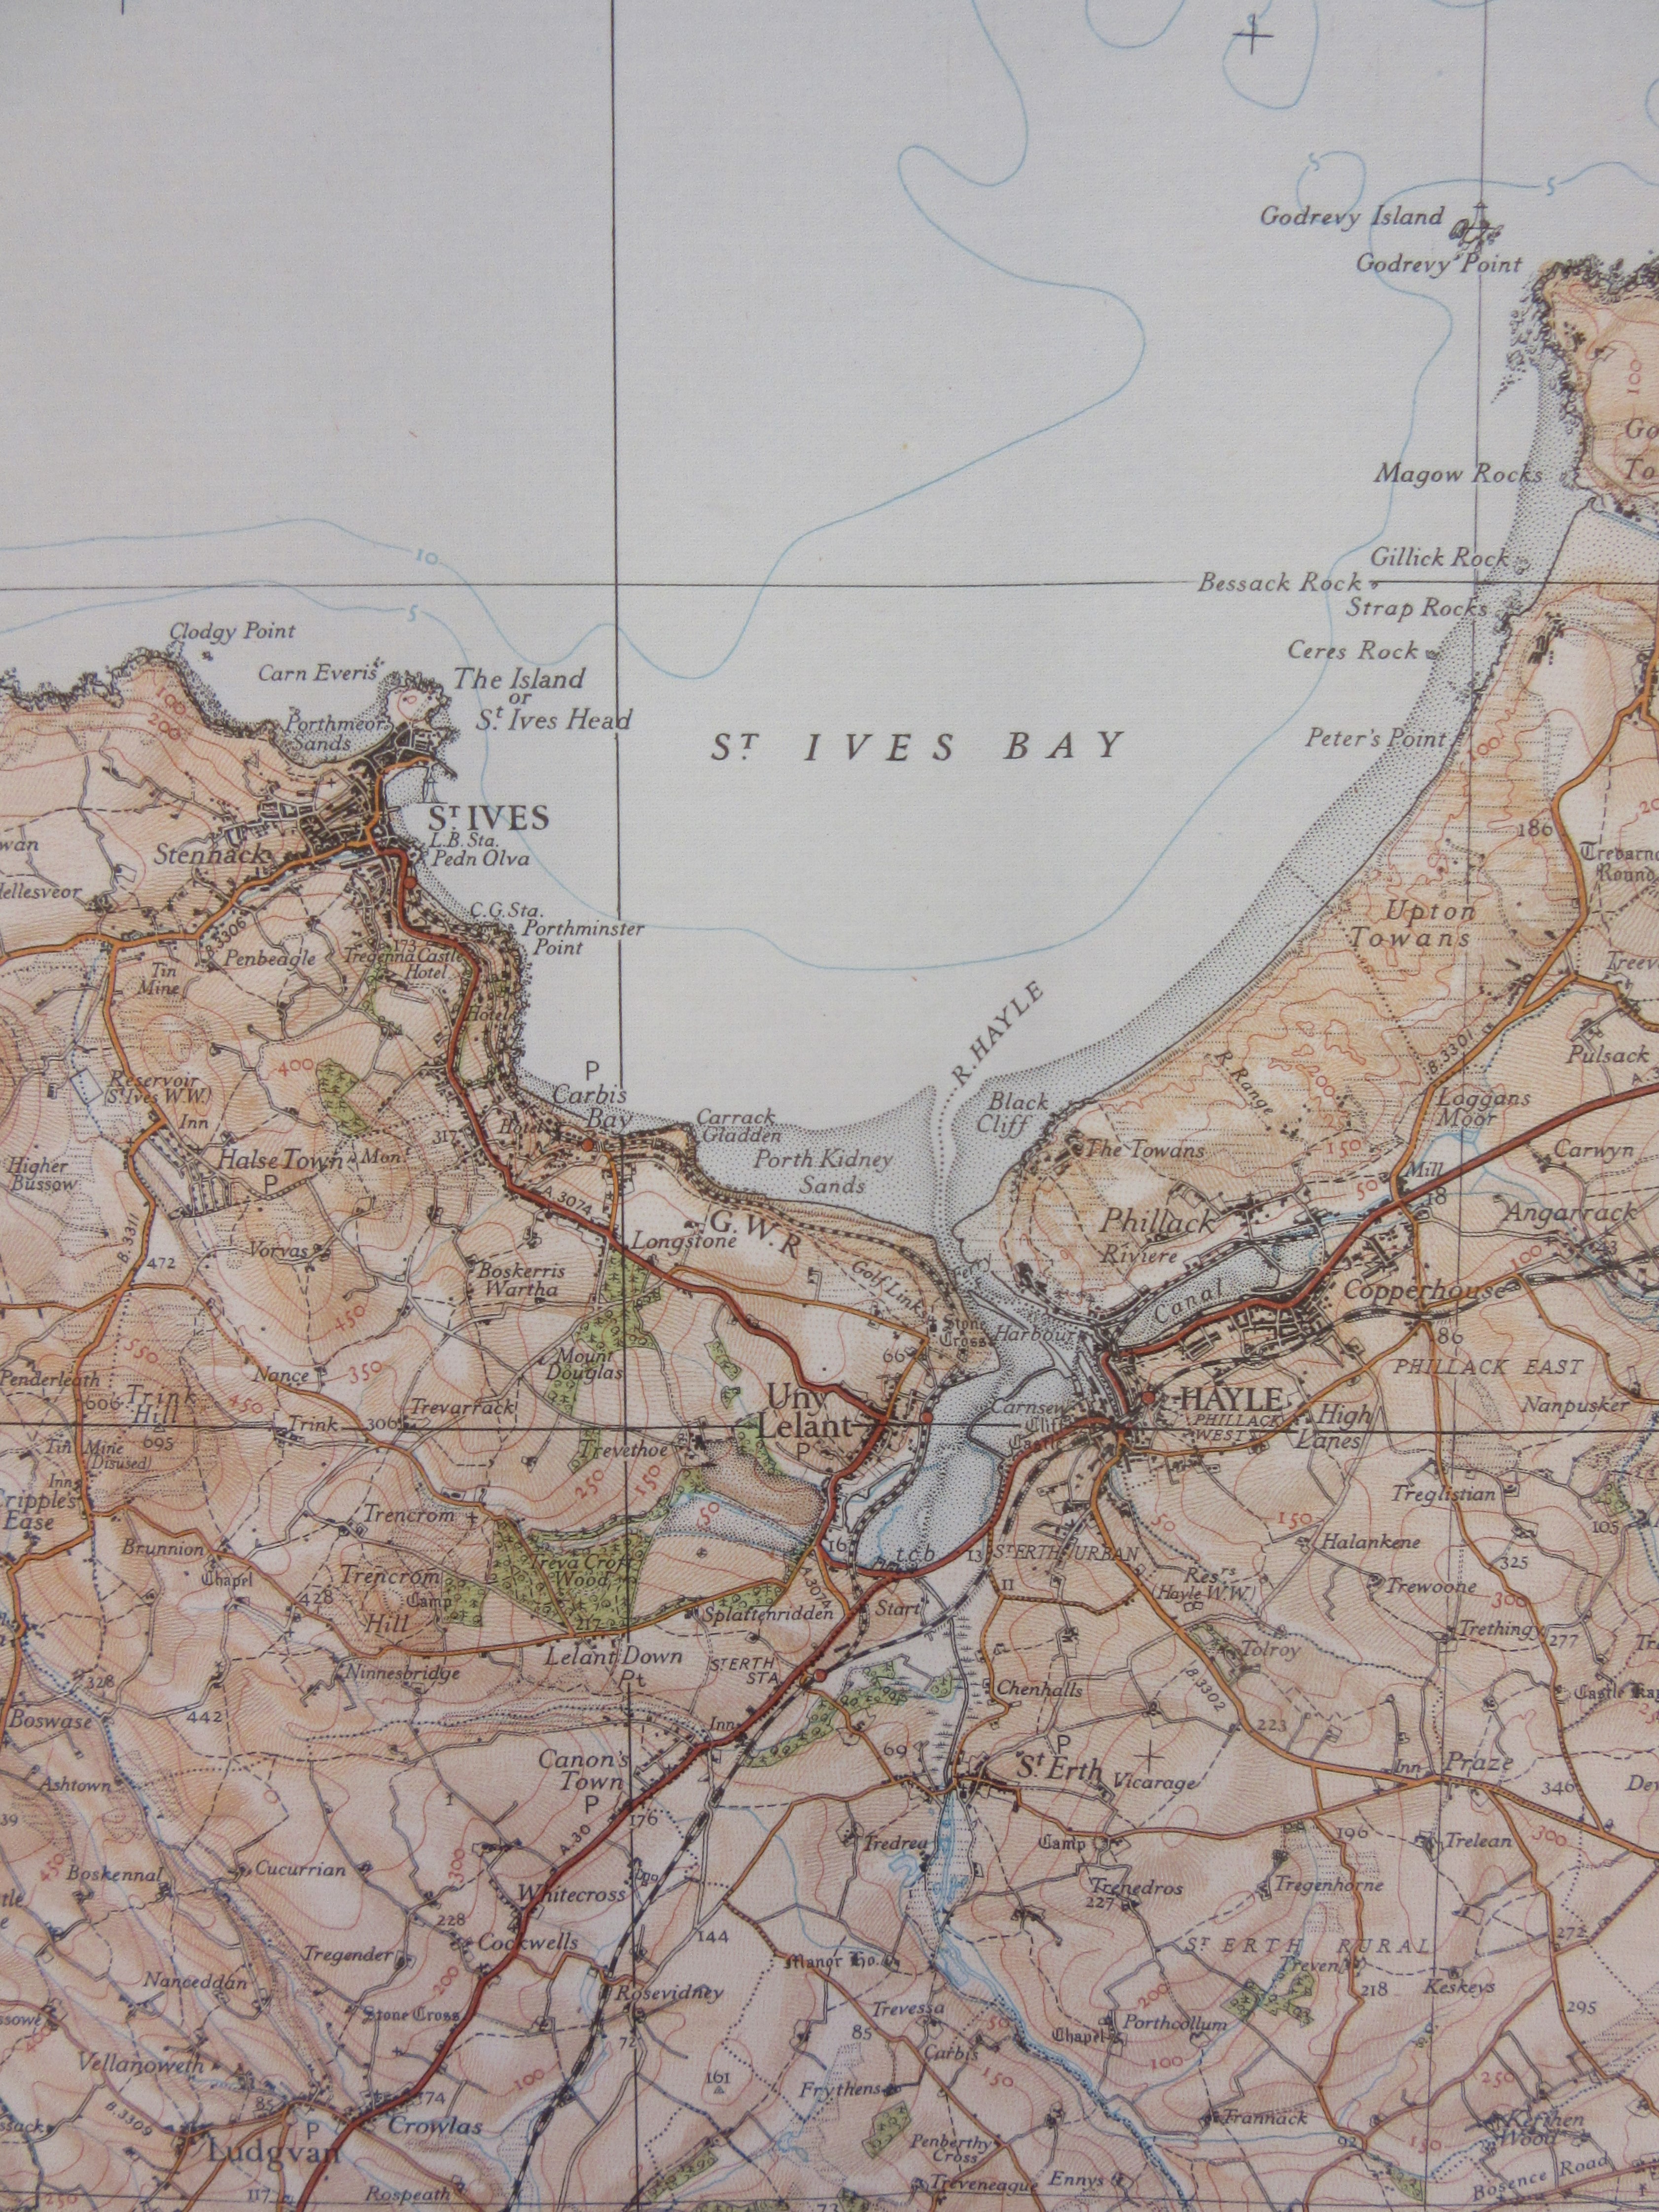
22 sheets of the 5th (relief) edition map of England and Wales were published between 1931 and 1936, and were available not only in a range of themes; coloured, physical features only, black outline and special district sheets, but also in a range of formats; paper flat, paper folded and mounted on linen. This sheet, number 146, was priced at 2 shillings and covers the Penwith Peninsula at the tip of Cornwall, a land of ancient field boundaries, roads that hug the coast and signs of early industry. It is also a land rich in prehistoric remains, though there is no indication of any of this on the map, instead you have physical features alone, contours, rivers, coastline and shading to give an idea of hills and valleys. It is a beautiful example of cartographic art. Here’s the normal edition for comparison, both maps date from 1934.

And then side-by-side extracts covering St. Ives Bay (click on maps to zoom in).


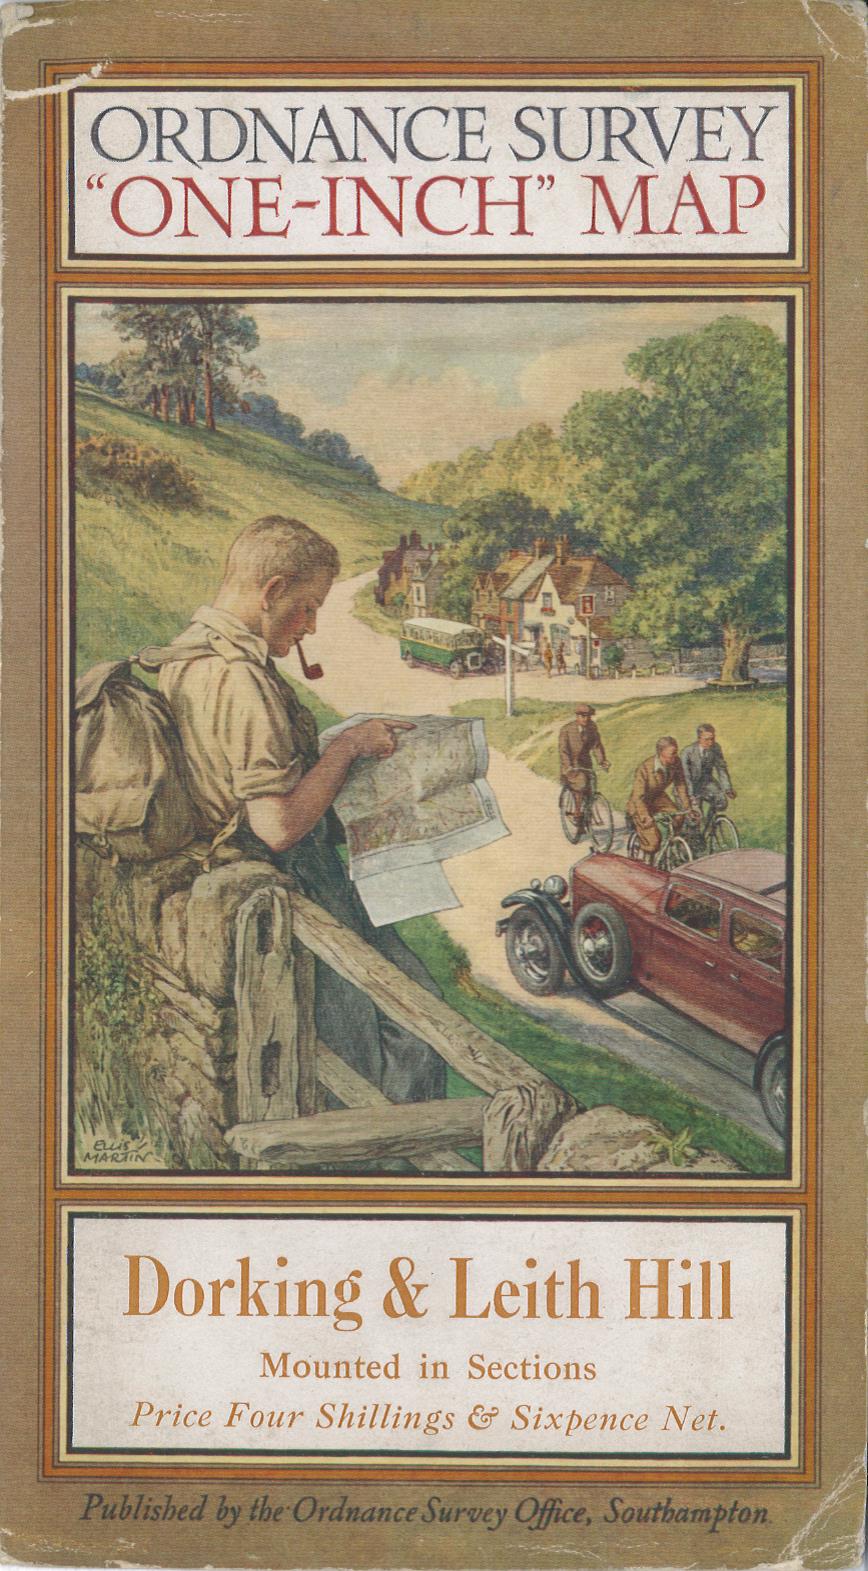
As expected the 5th edition is the fifth edition of a series of 1 inch to a mile maps first published in 1801. Weaving around these previous editions are a number of revisions, large and small sheet versions and, as mentioned already in this blog, variations on each to include outline, coloured or not and physical features mapping.  When all of these are taken into consideration there as many as nine previous editions, depending on how you count all published versions (and you could make an argument for more if you include military and geological maps as well). The covers were also beginning to be part of the whole package, with trained artists employed to capture the post-war spirit of the outdoors as a leisure activity, be it cycling or walking. With the 5th edition each cover had a similar design, with sheet number and name and a small portrait of a hiker. Soon covers would become more individual, reflecting the area mapped, and were miniature works of art in themselves (more on OS cover art can be found here) 

Fifth (Relief) Edition England & Wales, sheet 146  1934. C17 (30c) and C17 (30b).

Dog-eared

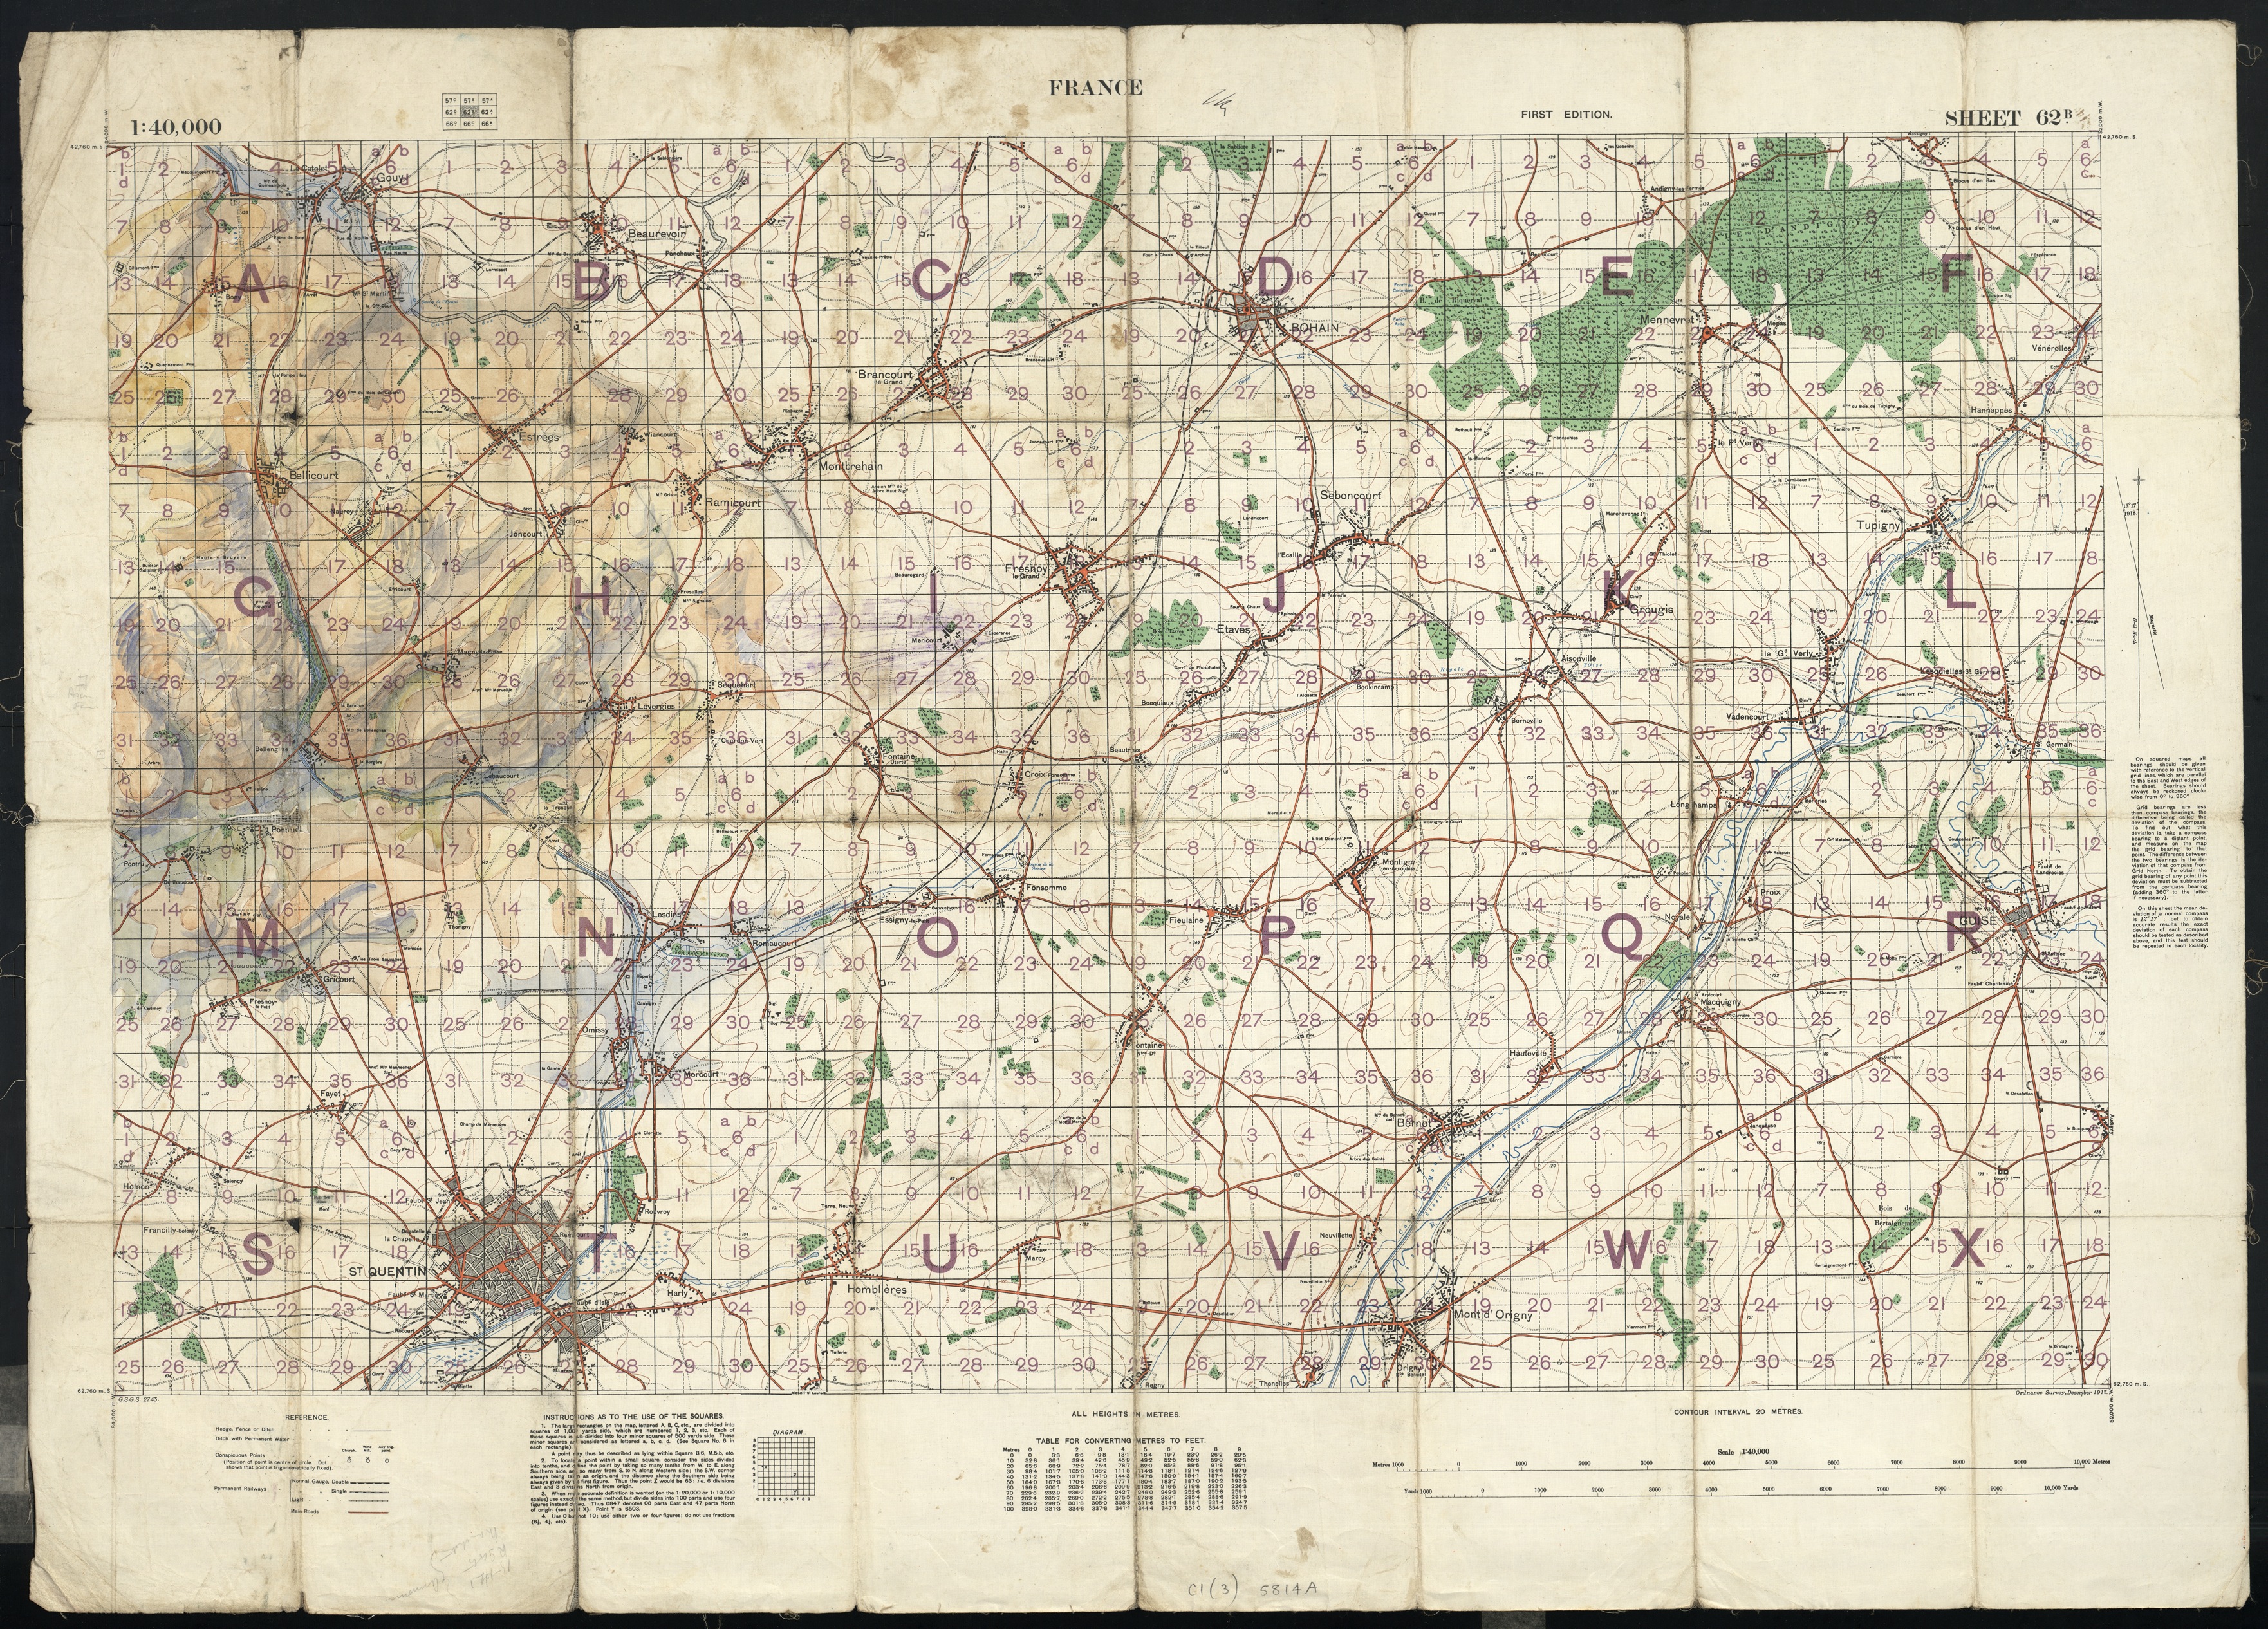
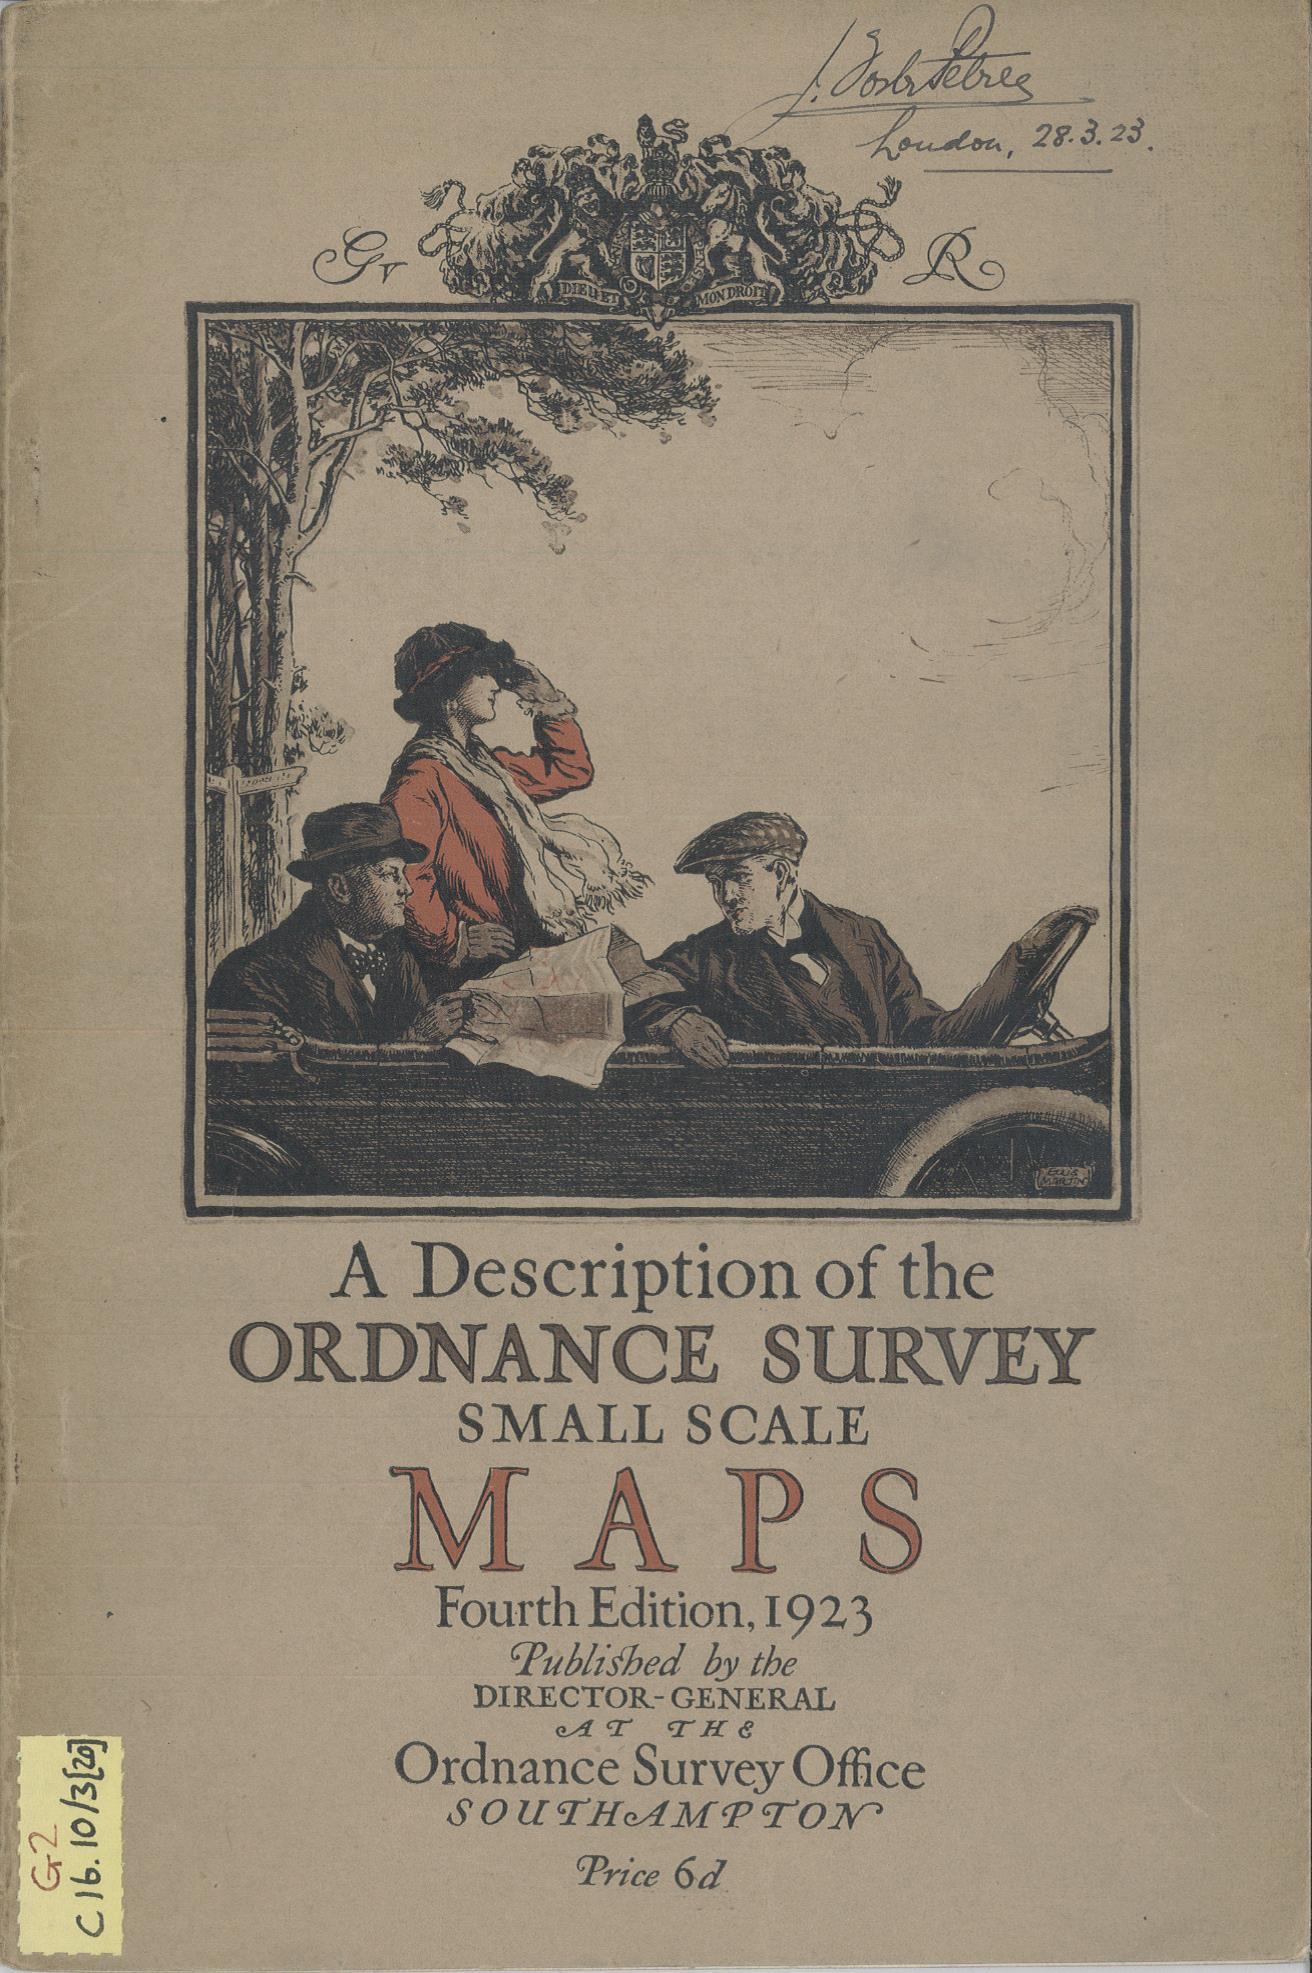
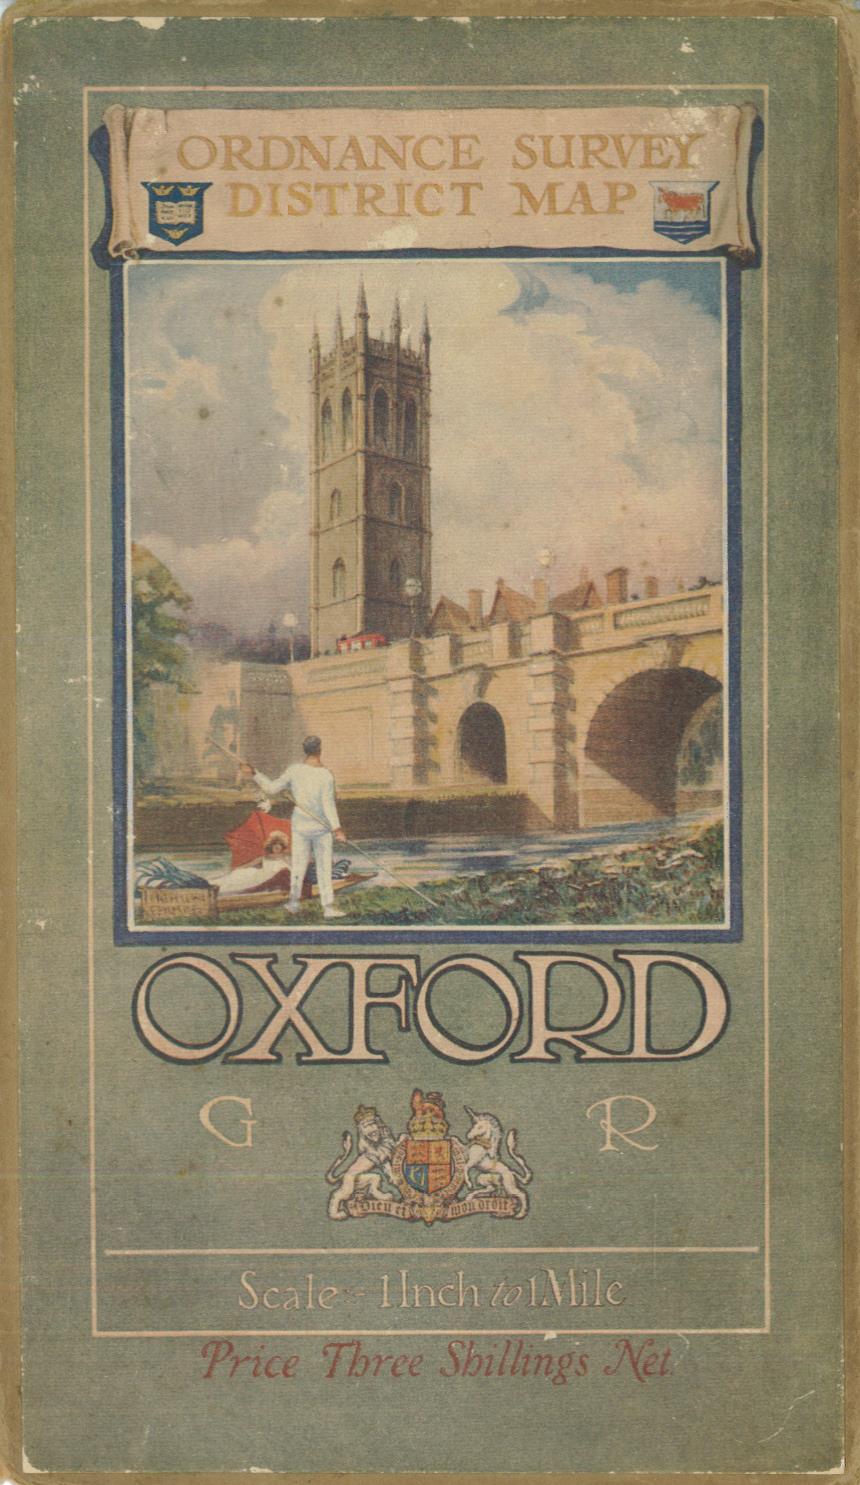
We all have maps like this. Dog-eared, well used, creased, pushed into pockets or bashed about in a rucksack. For whatever reason they show signs of wear and tear, which is an inevitable outcome considering the purpose of Ordnance Survey Landrangers and Explorers in the first place. Every crease or mark is a souvenir of a good walk or cycle.

This map, Landranger 194, Dorchester, Weymouth & surrounding area, from 1989 went on an early walking holiday with the future wife, in the early 90s. We took her dog Tess with us, an intelligent Labrador with a sense of fun. On one walk the map was spread out on the grass to plot the route and Tess walked across it. Tess is long-gone, but her paw print is still there, over Winterbourne Abbas and its stone circle, the Nine Stones. The map may have been superseded, but the personal importance will never go out of date.

We all have maps like this, don’t we? We have in the collections at the Bodleian. It’s exciting to come across a map that has been changed in someway, often to suit the owners’ needs. War seems often to be a cause, be it an altered trench map to show terrain

or a commercial Ordnance Survey 1/4″ sheet with additional marks made by a First World War pilot marking safe landing grounds around London (more on this map can be found here)

Then there are the plain bizarre, these links will take you to earlier blog posts of an intriguing burn mark on a map made during the Revolutionary period in France (here) and a map used by the film director Michael Winner to plan scenes for a film set during the Rome Olympics (here), 

Wife and dog on Dorset walk. Note state of paws, those aren’t socks.

Field patterns

Recent work on the Laxton map reminds us how beautiful maps often are, but also how beautiful the patterns made by field systems can be as well.

The central part of the Map of Laxton, 1635, MS. C17:48 (9)  (see notes at end for more information on Laxton)

Fields are a natural part of the landscape, but the dating of the fields can vary greatly depending on where you are. Areas of the West Country still have what is called Ancient Countryside, fields and farm land untouched by Enclosure acts. Fields at the tip of Cornwall on

the Penwith Peninsula are thousands of years old, a crazy pattern with small fields and many angles, utilizing boulders in the landscape too big to move or pre-existing ancient monuments such as standing stones and burial chambers. Due to the construction of these boundaries they are hard to move or alter, and it’s because of this that these field boundaries are, despite their age, still in use today. This type of landscape can also be found in areas as diverse as the Welsh borders and Essex, Sussex, Kent and Surrey. This extract comes from the 2nd edition Ordnance Survey 6 inch map of Cornwall, sheet LXI S.W., 1908. The Ordnance Survey shows fields up to and including maps at a 1:25,000 scale.

Laxton is an example of an Estate map. These are almost always manuscripts, with a cartographer commissioned to survey and produce a map with details such as field size, use and often details of individual field ownership.

Being a one-off often led to a beautifully illustrated and informative map. This example shows the  fields surrounding the Down Hall Estate in Essex (MS C17:28 (38), 1718), and was surveyed by William Cole, who was also a schoolmaster in Colchester. Down Hall Estate (home of Bake Off no less) features in the middle of the map, with details of the kitchen gardens surrounding the house.  Further examples of estate maps can be found here and here

One of the best maps of Oxfordshire, Richard Davis’s map from 1797, falls in-between the old practise of open fields and the new approach, that of Enclosure. This sheet shows the area to the East of Oxford (the county boundary followed the Thames until the 1970s) and has both big open fields and the new, smaller, patterns in place. The map shows the start of a new type of landscape, called Planned Landscape, neat fields with straight lines, without any of the quirks found in older field patterns, which often followed ancient parish boundaries and streams.

with an extract here

A new map of the County of Oxford : from an actual survey; on which are delineated; the course of the rivers and roads, the parks, gentlemens seats, heaths, woods, forests, commons &c. 1797                C17:49 a.1

This blog has been partly inspired but a recent series of programmes on the BBC called Winter Walks. Over 5 episodes people such as Simon Armitage, Baroness Sayeeda Warsi and the Rev. Richard Coles have walked in Yorkshire and Cumbria, holding a portable camera and accompanied by a drone giving aerial views of the incredible landscape and field systems on show. These field patterns can be seen in this Ordnance Survey 3rd edition sheet of Grassington (Yorks CXXXIV N.W., 1910). The field boundaries shown on the map would have been efficient way of using up stones found in the fields when ploughing. Dry-stone walling would also have the benefit of letting the wind through, reducing damage.

Be it from drone footage or walking in the country-side field patterns are revealed as objects of beauty as well as important agricultural features. They are also a chance for us to show off more beautiful maps from the collection at the Bodleian.

* The Laxton map, A Plat and Description of the Whole Mannor & Lordship of Laxton with Laxton Moorehouse in [y]e County of Nottingham and also of the Mannor & Lordship of Kneesall Lying Adiacent to [y]e Aforesaid Mannor of Laxton,   measures 178 x 203.5 centimetres on 9 rectangular pieces covering the villages of Laxton and Kneesall, around a dozen kilometres northwest of Newark-on-Trent. Dating from 1635. Approximately 3,333 separate field strips are shown on the map, which is made from sheep-skin. The area is still farmed using the open-field system, incorporating crop rotation, though to a lesser extent than at the time of the map.                           The Map Librarian at the Bodleian, Nick Millea, talks about the map here

The art of the Ordnance survey

Sales catalogues aren’t usually the most visually interesting of things, often only giving a list of that years products. What raised up the catalogues of the Ordnance Survey between the wars is the art that illustrated these catalogues, art that was mirrored in the covers of the maps produced by the company.

The covers and art work inside are mainly the work of two artists, who were also responsible for a large number of the most iconic of OS map art. Arthur Palmer joined the OS in 1891 aged 16 and worked for the company until retiring in 1935. Initially employed as a photo-writer (a photo-writer took the negatives created from a draughtsman’s work and tidied up any damage caused by scratches and dust specks which could obscure names and features), then in the Publications division. Palmer was also a gifted artist, and his work features in a number of classic designs, including this cover for a 1″ sheet of Oxford from 1921

and this cover from one of the catalogues of the large scale mapping.

The second artist was Ellis Martin. Martin, unlike Palmer, was employed purely as an artist by the OS to design not just map covers but fonts, promotional material and even company Christmas cards. His designs were less romantic than Palmers and his pen and ink work in particular was of the highest quality, as can be seen by this image of a hiker studying an OS map, a regular feature of Martin’s work. The hiker appears in various guises and as fashions changed so did the image, with the more formal cap and boots of the 1918 designs being replaced by this more practical working attire in 1933. The hiker featured in one of Martin’s most famous covers, that of the ‘Popular Edition’ maps of the 1930s. The use of the hiker, outdoors and ready to walk, is important for a number of reasons. It gives not only an impression of the type of countryside featured on the map inside, even if that is an idealized view, but also is a selling point, this is the ideal map for this type of activity.

Martin’s cover for the 1923 small-scale map catalogue is at the start of this article. A typical Martin scene which evokes both a sense of time and place with a simple design. The lady standing at the back of the car is Martin’s wife, Mabel.

This is another example of a cover by Martin showing his design skills. There is a book on the open shelves in the Map Reading Room on OS art, Map cover art, G24 C16.13.


Happy Christmas

This image comes for sheet Oxfordshire L.3 of the first edition Ordnance Survey County Series maps of England and Wales at 1:2,500. It is of the wonderfully named Christmas Common, in the Chilterns.

There are a number of suggestions for the name, a possible truce at Christmas during the Civil War or for the number of Holly Tree coppices in the area though a local family called Christmas sounds the most likely.

There are 8 place names which begin with Christmas listed in the gazetteer for the Ordnance Survey 1:50,000 series, including the wonderful Christmaspie in Surrey (this image from the 3rd ed OS 1:2,500 sheet Surrey XXIII.13, 1910. Only the first edition was available in colour as well as black and white).

Happy Christmas everyone.

Heliometer Domes and OS maps

The Ordnance Survey 1:500 map series are amongst the most detailed of all town plans. Dating from the 1880s and covering all towns with a population over 4,000, at this scale roofs come off important buildings to show the layout of the rooms underneath. While going through the maps covering Oxford this intriguing building appeared, the Heliometer Dome, part of the Radcliffe Observatory buildings.

The Observatory moved to Pretoria in 1934 hoping for clearer skies than could be found in Oxford, the buildings are now part of Green Templeton College. As well as showing on a beautiful map the Heliocentre has other cartographic claims for appearing in a map blog as it was a device crucial for measuring distances in space. The telescope in the Heliometer has a split lens, one of which is fixed in position, the second adjustable, thus producing a double image of either nearby stars or either sides of the Sun. By moving one of the lenses these images can be superimposed and then the different lengths of the lenses can be measured which will give the difference in distances between stars, a concept called parallax.

The Heliometer Dome circa 1860.

This next map is an extract from Robert Hoggar’s celebrated map of the city from 1850. At a scale slightly less detailed then the Ordnance Survey (1:528 as opposed to 1:500) at the top of this blog, like the OS map Hoggar maps individual trees and outbuildings, unlike the OS Hoggar includes contour lines.

Plan of the City of Oxford. 1850 (E) C17:70 Oxford (1)

This last image is the front cover from a record of the magnitude of stars according to their observable light recorded at the Observatory in 1853.

We’ve blogged about Parallax before http://blogs.bodleian.ox.ac.uk/maps/2015/07/10/parallax/  and about Ordnance Survey 1:5000 town plans as well http://blogs.bodleian.ox.ac.uk/maps/2018/03/01/pretty-in-pink/