Sail away to Christmasland

Everyone has heard of Christmas Island, but have you heard of Christmasland? The (fictional) island appears on this cartographic Christmas card from the 1930s. Christmasland: Captain Jolliman’s voyage of discovery in ye “Friendship” (see what they did there?) shows a route from Humdrum Drearyland, with its Workaday Coast, to Christmasland.

The island has many seasonal placenames such as Mistletoe Bay, the Forest of Greetings (the forest symbols being, appropriately enough, Christmas trees), Welcome City, Kiddies Country and the Coast of Old Friends. The River Gin and the River It combine to form Cocktail River (hurrah!) and there are various plays on words relating to place names, such as Port Wine, and the Sound of Bells. The captain’s route continues past Pudding Point, through the Financial Straits, amongst the Hangover Rocks and past Resolution Point to New Years Land.

Cartographical allegories like this have been produced for centuries. Maps along these lines illustrating the “land of love” or themes around courtship and marriage became popular in seventeenth century France, and soon spread to other European countries including England. Allegorical maps with a morally improving theme also appeared, illustrating the spiritual journey through life. In the eighteenth and early nineteenth century allegorical maps as games were also popular. Meanwhile, in the nineteenth century, the Christmas card was gaining in popularity, as outlined in this recent blog from the Bodleian’s John Johnson collection.  But Christmasland, combining the two, may be a one off.

The card was donated to the Map Room recently, after it was spotted in the Oxfam shop in Chipping Norton by a Bodleian reader. Such ephemeral material often doesn’t survive so it was a welcome addition to the collection.


The card is printed inside with an address in Hillcrest Avenue, Pinner, then as now a pleasant road in an affluent commuter town on the outskirts of London. It is signed by hand, and dated Christmas 1936. There is also a quotation:

Hope shall brighten days to come
And memory gild the past

From a poem by the Irish writer Thomas Moore. These words, and a printed greeting with

Remembrance and kind thoughts for Christmas with good wishes for your happiness in the future

is something we need in the current difficult times. Happy Christmas!

Reflections on the Alps

December 11th is United Nations International Mountain Day, so we’re celebrating with this unusual Alpine panorama.  This map of an Alpine road appears at first glance to be a view of mountains reflected in water.  Closer examination shows that a road runs along the centre of the map; it is printed on a long strip, folded concertina style, with the road shown as a straight line and panoramic views of the mountains on either side. Unusual formats like this have been used in other Alpine maps, to address the challenge of portraying a long vista on paper; a panorama of the view from the summit of Mont Blanc featured in an earlier blog post.

The map was drawn by the poster artist Louis Guerry, and published in Grenoble in 1896 by Joseph Baratier. It shows the road between Vizille and Briançon in France, close to the border with Italy. Side roads wind off into the mountains and small Alpine settlements are marked along the way. Highest and most dramatic of the mountains is La Meije, with five peaks and glaciers flowing down either side; it was one of the last major Alpine peaks to be climbed, and also features on the cover illustration (above). Other names, such as Galibier and Alpe d’Huez, will be familiar to fans of the Tour de France cycle race;  the road up to Alpe d’Huez did not at this time reach all the way to Huez itself, which appears as a high isolated village.

This copy came to the library recently, a donation from the grandson of Thomas Arthur Rumbold. When Rumbold joined the Alpine Club in 1902 he was their youngest member. His application shows an impressive list of climbing experience from the late 1890s; it includes  mountains in the French, Italian and Swiss Alps, many of them “without guides”, and rock climbing in the Allegheny Mountains in Virginia. The map was donated along with Rumbold’s trench maps from his time serving in WWI, which were a welcome addition to our collection. Happily, Rumbold  survived the war; he went on to become Secretary to Sir George Schuster, Governor of the Bank of England. He also found time to enjoy more Alpine fun in the snow (see below) and eventually became the oldest member of the Alpine Club!

Thomas Rumbold and friends enjoying St Moritz. Photo shared by his grandson.

The map folds into a small cover with a conventional route map on the back.

The map when extended is over 2 metres long.  As we admired it in the Map Room office, we reflected that in these times of Covid restrictions it is rare to find a map so long that more than one person can look at it at once while social distancing.

Dépliant Alpestre : Excursion en Oisans. Projection sur 100 kilometres des sommets du Massif / dessiné par Louis Guerry. Grenoble : Joseph Baratier, [1896]. C21:44 (48)

You can see more about this map at the website of the Bibliotheque Dauphinoise.

Thanksgiving

Today is Thanksgiving, celebrated in the United States and Brazil on the 4th Thursday in November (Canada celebrates on the 2nd Monday in October with a few other countries throughout the World using either of these or dates around these days as well). Thanksgiving is a harvest based celebration, and, more importantly here, is also connected with early English settlements in the United States. It’s a chance for us a post a blog featuring one of the treasures of the Library, John Smith’s beautiful map of Virginia, dated 1612.

Smith was Governor of the Colony of Virginia and one of the founders of Jamestown, the first permanent English settlement in the United States. Smith’s map is orientated with west at the top, the best way to represent on paper this elongated stretch of country. The Chesapeake Bay is the horizontal stretch of water just below the centre of the map with Jamestown, in red, on the Powhatan (now called the James) River. Smith shows the areas both explored, often by himself, and unexplored, using crosses on the rivers to show the limits of European knowledge. Most striking though are the images of Native American life, on the left is a scene showing the local chieftain Powhatan and members of the Powhatan tribe while on the right is a Native American with the inscription ‘the Sasquesahanoughs are a gyant like people & thus a-tyred’. Maps played a crucial role in the early history of the United States. Dutch, English and French interests in territory made the setting down of ownership and boundaries on maps and documents a way of establishing claims and legitimacy to land which would go on to play a crucial role in the way the early history of the country developed.

This map comes from a book Smith wrote about his time in Virginia, called ‘The First Booke of the First Decade contanying the Historie and Travaile into Virginia-Britania‘, and came to the Bodleian from the collection of Elias Ashmole, founder of the Ashmolean Museum. Ashmole had donated his collection to the Ashmolean in 1677, this was then passed onto the Bodleian in 1860.

MS. Ashmole 1758. 1612

Measuring distances, a wheel or a chain?

John Ogilby has to be one of the most interesting of all the cartographers. Before turning to making maps aged 66 he had at various times been a dancer and dance instructor, theatre manager and publisher, with career changes usually the result of misfortune of some kind. His dance career ended after suffering serious injury during one performance, his career in the theatre in Dublin came to an abrupt end due to Irish rebellion against the English in 1644 and then finally he lost most of his publishing stock in the Great Fire of London.

It was the fire that set Ogilby on a new path as a cartographer. After mapping the devastated city to aid in redevelopment Ogilby embarked on the project that would not only give him lasting fame but introduced a new way of mapping  roads. In 1675 Ogilby published the Britannia, an atlas of 73 routes at a scale, for the first time, of one inch to the mile (1:63,360). As can be seen from this example Ogilby revolutionized the way maps were shown by only focusing on the relevant information for the road user and by making the best use of space while creating maps full of useful information and easy to understand.

Miles are marked on the road maps with furlongs in between the miles shown by dots (a furlong being the length of a furrow in a common field, by Ogilby’s day there were 8 to a mile). Compass roses show north and hills are drawn in a way to show if you are travelling up hill or down. The cartouche includes figures surveying and using tools that would have been used to map out the route and recorded the miles.

The wheel on the end of the stick was called a way-wiser that recorded each turn of the wheel on a dial,  while underneath that a winged figure called a Putto is using a Gunter’s chain, invented in 1620, which was laid along the ground to measure distances. The chain measured 66 feet divided into 100 links, ten chains length was a furlong, 80 a mile.  The figure on the horse is holding a compass.

Ogilby died the year after the publication of Britannia, but his work stayed in print, first through the efforts of his step-grandson William Morgan (who like Ogilby was appointed ‘His Majesty’s Cosmographer’), and then through, acknowledged or often not, the works of later cartographers, all making use of such a rich and inventive source of information.

There is one more intriguing chapter to the story. Ogilby was closely allied with Charles II, and there is a theory that Britannia was published to help with a proposed invasion from France to restore the Catholic faith in the country. For some the emphasis that Britannia places in routes to poorly populated ports and locations in Wales and the West Country and the publication date being so close to a signing of a secret treaty with France (so secret it didn’t come into public knowledge till 1820) shows that this was a road map with a hidden agenda, and it is only with this agenda in mind that some of the seemingly random things shown on the maps; a house in the middle of nowhere, mines in one location but not others for instance, begin to make sense.

In the corridor outside the Map Office here at the Bodleian nine portraits are hung. Two are of cartographers; John Speed, the famous Tudor map maker, and John Ogilby, both of whom originally were named in their picture. Ogilby’s name has at some point been painted out, this may be due to changing fashions as none of the other, later, seven portraits name the person in the picture. We can’t be sure though if his name has been erased deliberately, another layer of mystery attached to a man who had more than his fair share throughout his life.

Britannia, volume the first, or, an illustration of the Kingdom of England and Wales by a geographical and historical description of the principal roads thereof…1675. Vet A3 b.10


Treasure Unearthed!

Treasure Unearthed!

Shelf checking a printed book collection I came upon an uncatalogued atlas which looked very interesting.  Although it had engraved and letterpress title pages for Visscher’s Atlas Minor it was, in fact an atlas factice of mainly seventeenth century maps from atlases of various publishers. It is contained in the Bodleian’s collection of books belonging to John Locke (1632-1704), philosopher and influential Enlightenment figure.

Locke was awarded his master’s degree from Christ Church, Oxford in 1658 and developed into polymath and in 1668 was elected as a Fellow of the Royal Society but his interests also covered amongst others medicine, political theory and religious tolerance and influenced by Bacon, Descartes and Hobbes.  Throughout his life he wrote and disseminated his ideas on this range of subjects so it is no surprise that he would have amassed a collection of maps.


After his death in 1704, his library was left to his cousin Peter King, later Lord King when in 1947 the Bodleian bought some of the books and manuscripts. The remainder were found at Ben Damph Forest, the seat of the Earl of Lovelace (as Lord King later became) and were later bought by Paul Mellon who then presented this collection to the Bodleian in 1978.


The volume itself contains 48 maps, charts and plans produced and published by the leading cartographers contemporary with Locke, so along with Visscher, Frederik de Wit, Carel Allard and Peter Schenk also featured.  Additionally included is an ephemerides by Jean Baptiste Coignard which would have sat well with the maps. Map number 15 A New Chart of the Sea Coasts Between England and Ireland by Richard Mount is uncommon and unusually oriented with west at the top.

The binding is the original vellum with blind stamped border and corner pieces; and large ornament with evidence of ties. There is a spine title in manuscript (Locke?) Visscher Atlas. There is a circular red morocco bookplate with a gilt image of stook of corn and lettering “Oak Spring, Paul Mellon” indicating its later provenance.


Atlas factice of mainly Dutch 17th century maps  Locke 22.1

To the readers hello

This remarkable early example of a town plan shows the French port of La Rochelle under siege in 1573.

During the French Wars of Religion La Rochelle had become a centre of Huguenot support, and was besieged by troops loyal to the Catholic Duke of Anjou. The siege was lifted in the year the map was made and La Rochelle became one of the few cities in France where Protestants were allowed to worship.

In the box in the top left, ‘Aux lecteurs salut’ (To the readers hello) the cartographer first claims he has made this map to meet the desire of the most curious, and then sets out what his map shows; the defences and how the rebels holding the city were besieged both from the land and the sea, the damage caused within the walls and the names of locations. The text ends by stating that the Royalist forces did not spare any lives or goods in order to deliver to the King victory, though the siege was lifted in June 1573 without outcome. The brief publishing information at the bottom of the map is intriguing. The text tells us it was made by F. Desprez in the Rue Montorgueil, Paris, there is then the words ‘au Bon Pasteur’ (the Good Shepherd or Pastor) which may relate to the fact that Desprez worked close to the Church of Saint-Eustache.

The map clearly shows the formidable fortifications La Rochelle had, full of thick and angled walls designed to deflect cannon fire and force attacking troops into narrow spaces easy to attack from the walls. More on this type of fortification and the beautiful maps that show them can be found here

The map publication date of 1573 means it is a very early example of a town plan held in the Bodleian. The earliest for Oxford is from 1578 (Ralph Agas, see an image here,). For London 1572, a map that comes from an atlas of town plans called Civitates Orbis Terrarum, an earlier blog post gives more information about this celebrated atlas here

Portraict de la Rochelle, & des Forteresses q les Rebelles y ont faict, depuis les p’miers troubles jusque á pňt. 1573. (E) C21:50 La Rochelle (1)

Overlooking a city

It’s not uncommon to see a map that makes you go “Wow!” at first sight. Generally the early printed and manuscript maps in the collection are most likely to inspire this response, but this recently acquired map of Buenos Aires, printed in 1950, had much the same effect when I first saw it.

More of a birds-eye view than a map, it almost gives the feeling of flying over the city. The layout of Buenos Aires in a regular grid pattern enhances the sense of perspective. Many features are shown pictorially including major buildings, parks, monuments and boats in the port in the foreground. The sea is coloured a beautiful dark blue. Overall the colour scheme is simple, the map being printed in black plus 5 colours. All along the bottom of the map is a view of the city.

It’s the work of Viktor Cymbal (surname sometimes rendered Tsymbal), a Ukrainian artist and designer who lived in Buenos Aires for much of his life from his late twenties, although he spent his final years in New York. More information can be found about him here.

The style is somewhat reminiscent of the work of Macdonald Gill, another artist whose work (like that of Cymbal) included both maps and illustrations for advertisements. In particular the simple colour scheme, pictorial elements, and the lettering style and yellow scroll devices as labels are interesting to compare. Gill featured in an earlier blog post focusing on a map made in 1941, just nine years before this one.

The map was made at a time when Argentina was flourishing under popular president Juan Domingo Péron and his even more popular wife Eva. The railway station at bottom right bears the president’s name.

El corazon de Buenos Aires/ Viktor Cymbal. Buenos Aires : Editores Peacock y Calegari, 950.  H3:35 Buenos Aires (19).

Why some maps lie and how they do it

Maps are 2-dimensional representations of a location, created by a cartographer, editor or publisher. Most are straightforward in that they portray accurately (hopefully) that area covered. Occasionally they mislead, either accidentally or deliberately. A misleading map played a part in one of the most famous and important events in World history. Christopher Columbus’s decision to sail west to reach the East Indies was partly due to a map in an atlas of maps by the Classical cartographer Claudius Ptolemy (c. 100-170). While this map was the most up to date

based on contemporary knowledge it  missed parts of the Earth as yet undiscovered by European explorers. Without the knowledge of a whole new continent in the west Columbus set sail hoping to find a new and quicker route to the East Indies but instead discovered the New World ( To read more about how the Bodleian’s copy of a Ptolemy atlas has an amazing connection with Columbus click here).

Another  intriguing example of misleading cartography is the representation of ‘Phantom Islands’ on maps. These are islands which for a number of reasons; low cloud, recording already surveyed locations as ‘new islands’  and mirages have all been the cause in the past, are mapped and then continue appearing on maps as cartographers use old information, until a new survey is made or a ship reports that the island doesn’t actually exist. The inset on the right is of a map made in 1710 of South America which features Pepys Island, named after the famous diarist who was also the Secretary to the Navy. Lying off the coast of Argentina  and first recorded in 1683. Pepys Island was shown  on maps for over 150 years until 1839, when was finally proved not to exist. This extract is from South America corrected from the observations comunicated to the Royal Society’s of London & Paris… by John Senex, which featured in a blog here

These are just a few examples of how maps can, without meaning to, lie (or, to be fairer, give incorrect information). There are a number of examples though of publishers deliberately making mistakes on their maps. Soviet-era maps intended for Western visitors were often  misleading to avoid Western states having accurate mapping of Soviet cities and towns. Some commercial publishers include false information amongst their maps to catch competitors out who have copied work without acknowledging or seeking permission, This is more common on street atlases, which is why the these false inclusions have the rather wonderful name of ‘trap streets’.

The reason for this long preamble is that, like other colleagues in the Map Room at the  Bodleian, i’ve spent a good part of the lockdown going through scanned images in folders and recording shelfmarks and other details (see the blog ‘Rummaging through virtual maps’ directly below). My work has involved working through the Bodleian’s trench and other maps of the First World War. These are amongst the most evocative of all the maps in the collection, full of names that for anyone interested in history are instantly recognizable; Mametz Wood, Passchendaele, the Somme, Messines and Vimy Ridge.  These are maps made for, and used in, the planning and carrying out of operations that in some cases cost the lives of thousands while making miniscule gains in land. But the reason for including these maps in this blog is that the more detailed trench maps, at 1:10,000 and 1:20,000 scales, ultimately, but necessarily, lie. For example take this extract of a trench map covering the French city of Lens.

The red lines to the right are the German front-line and support trenches, the blue lines are the Allied trenches (most trench maps only show the Allied front-line, it’s not often that you have so much Allied trenches shown in case the map was captured by the enemy). These trenches, the information relevant for the December 1917 date of the map, are overlaid onto a pre-war map showing what looks like a normal French city with railways, roads, houses and churches. In reality the city had been heavily bombed during the War with most of the buildings levelled, and the trenches were made out of the rubble caused by bomb damage.

A better example of the contradiction between map and ground can be achieved by comparing this map covering Chateau Wood with a photo of the same area. Chateau Wood is east of the Belgian city of Ypres and had been behind the German front-line until Allied advances towards the Passchendaele Ridge in the Third Battle of Ypres in 1917.

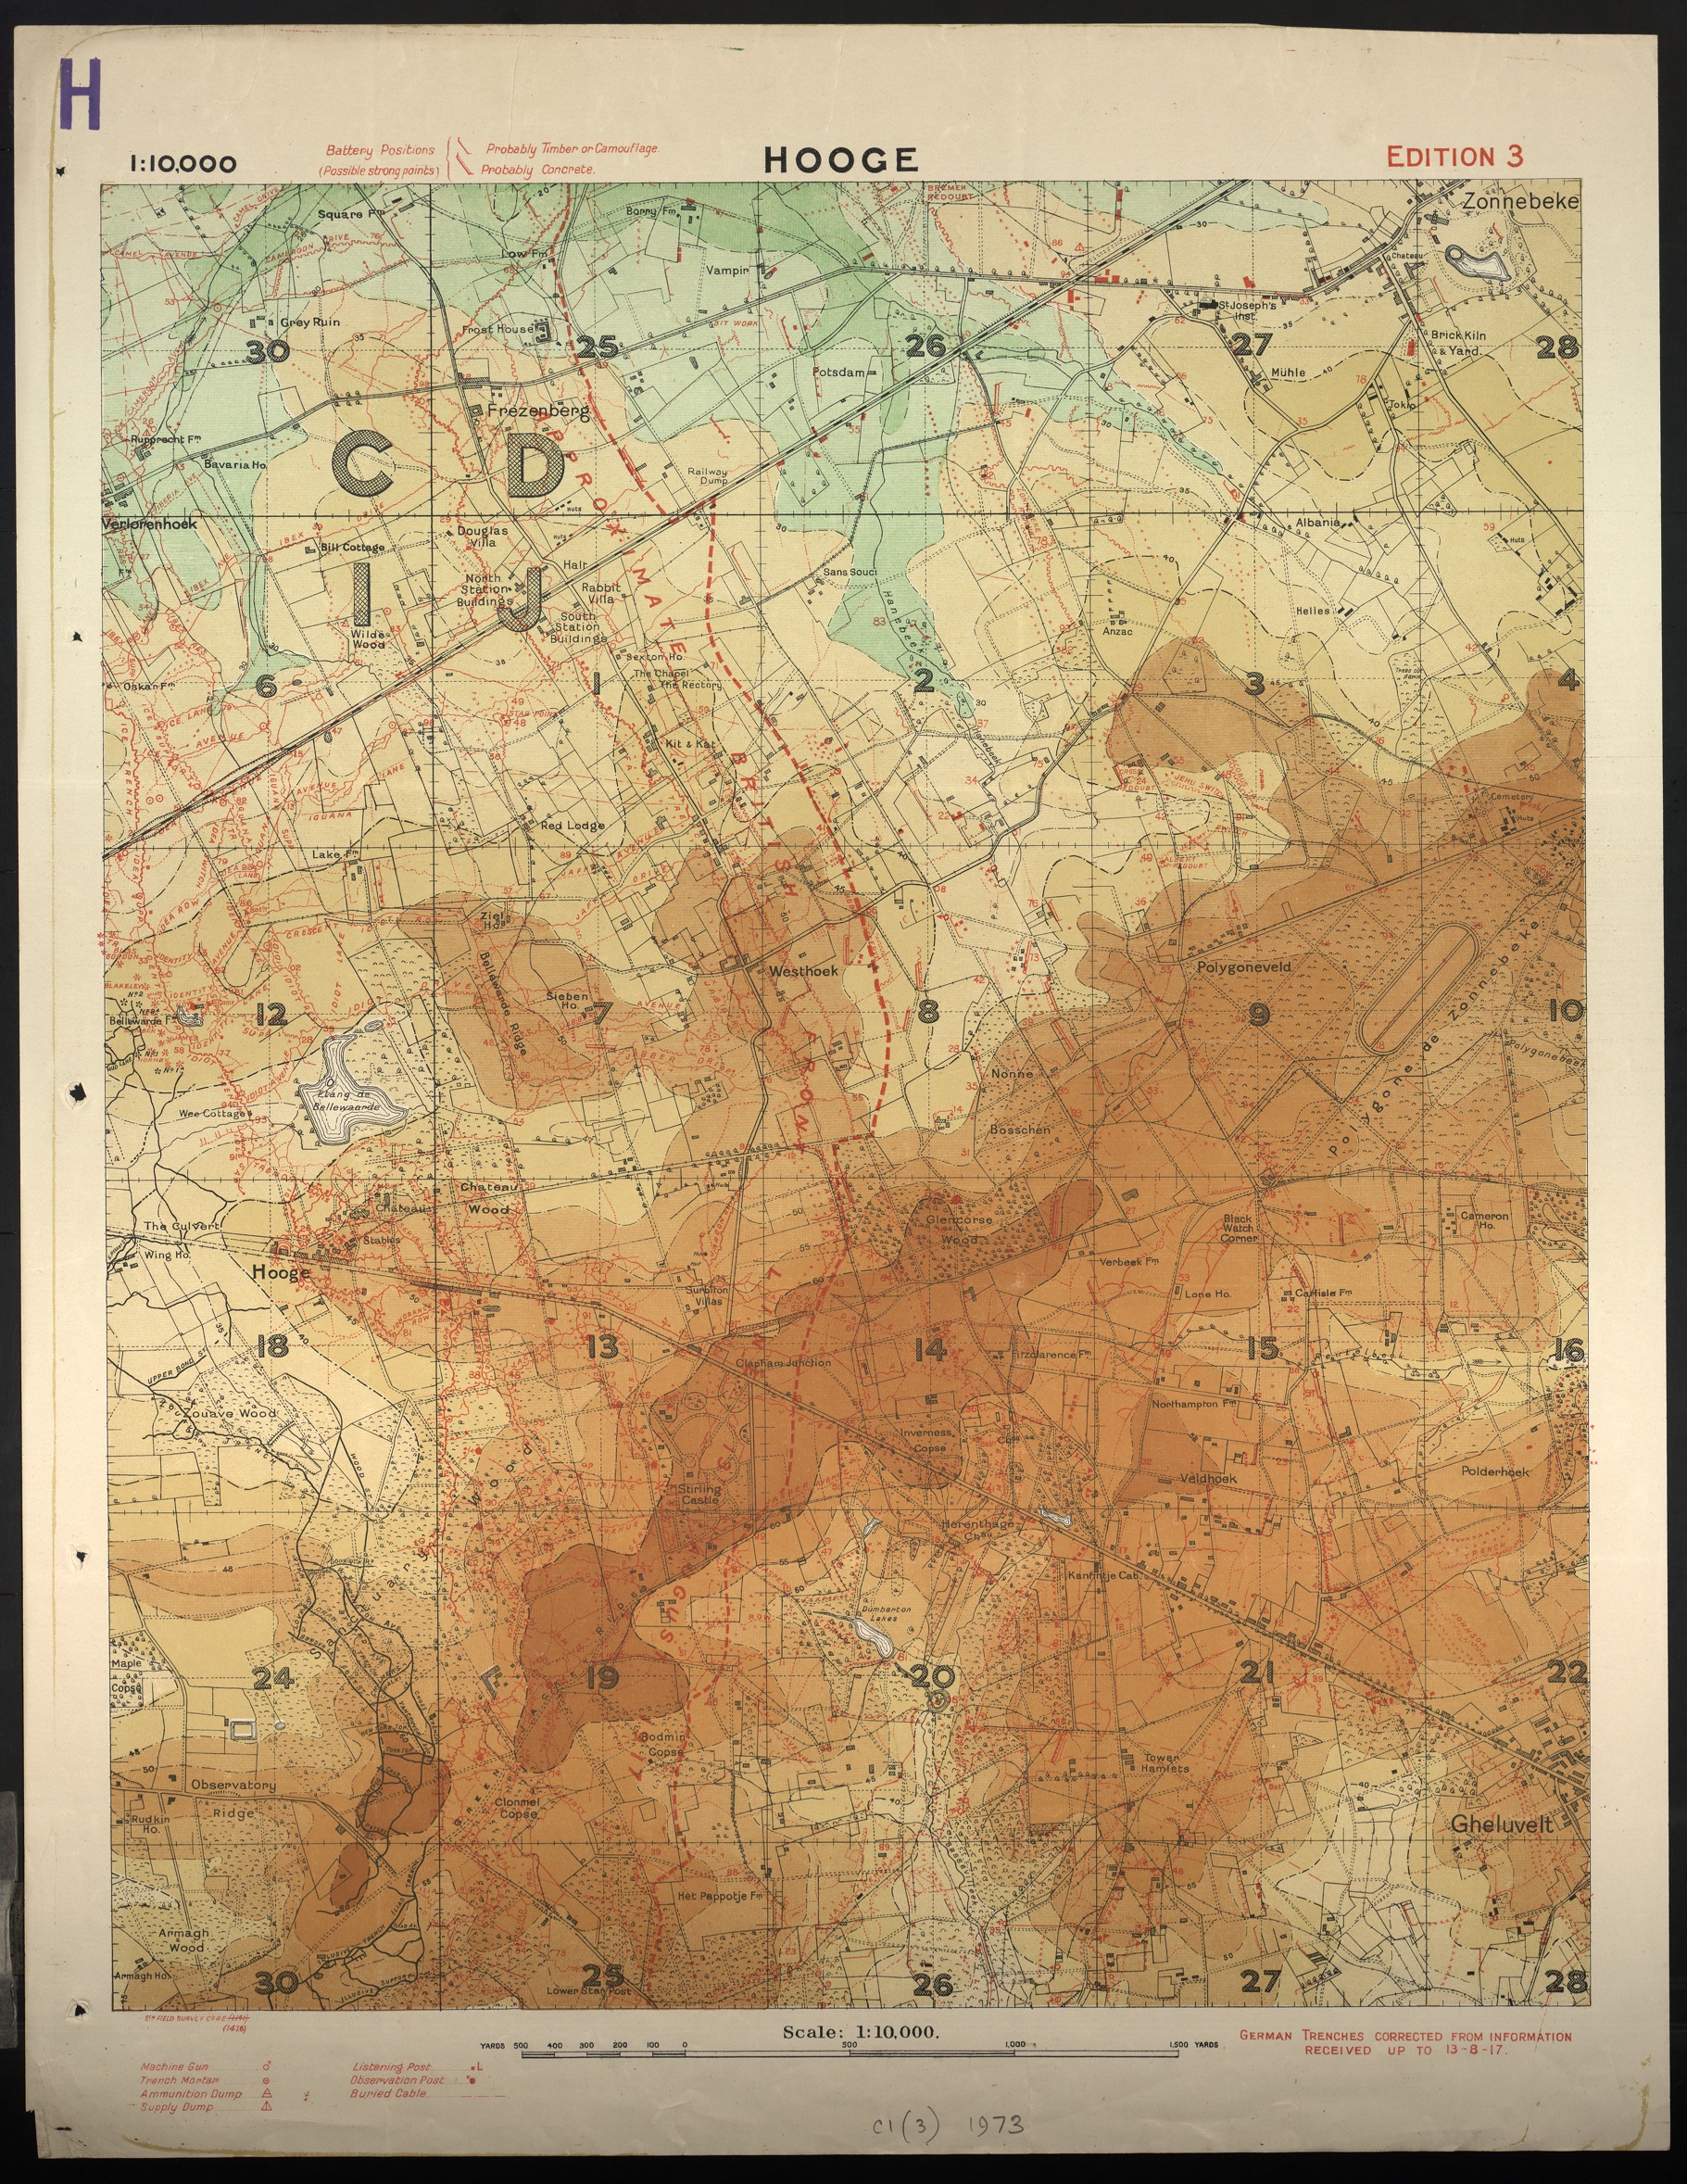
Hooge, 3rd ed, 1917. C1 (3) [1973]

 On the trench map the Wood has  field boundaries and tracks through the trees (Chateau Wood is east of Hooge in square 13, and can be seen in this extract). Compare the calm and ordered landscape portrayed on the map with the reality on the ground from this photograph of duckboard tracks going through the wood taken in October after advanced beyond the wood and beyond towards Passchendaele.

Ultimately though how do you map land like this which has had all recognizable features long-since destroyed and ground constantly altered by artillery fire? During major battles maps were produced on a regular basis to keep as up to date as possible with an ever-changing front-line, hard enough to do if just mapping the new positions of trenches, impossible to complete if you mapped each new shell crater or destroyed pill-box. To have vital and ever-changing information such as trenches and enemy positions printed over a landscape that was no longer there but was shown on pre-war mapping was, with the need for accurate and quickly produced maps, the only option, but by necessity a lie.

For more on trench maps and the Bodleian Library click here
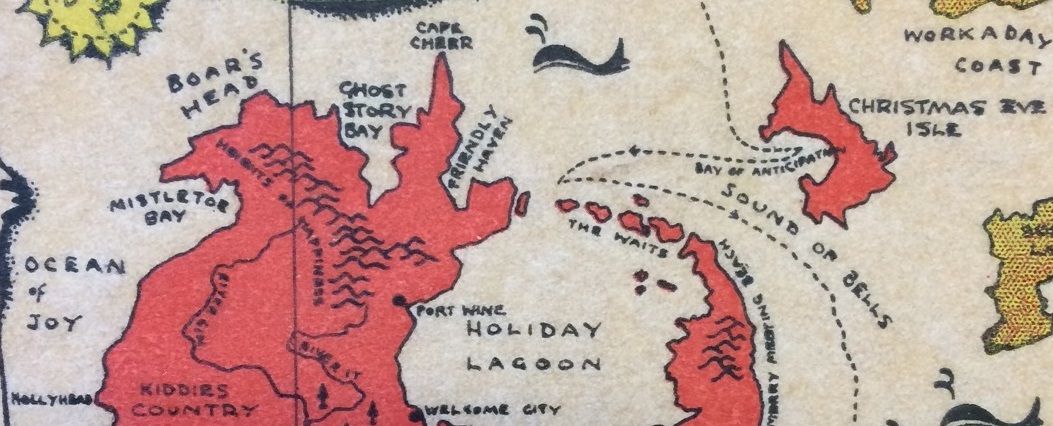
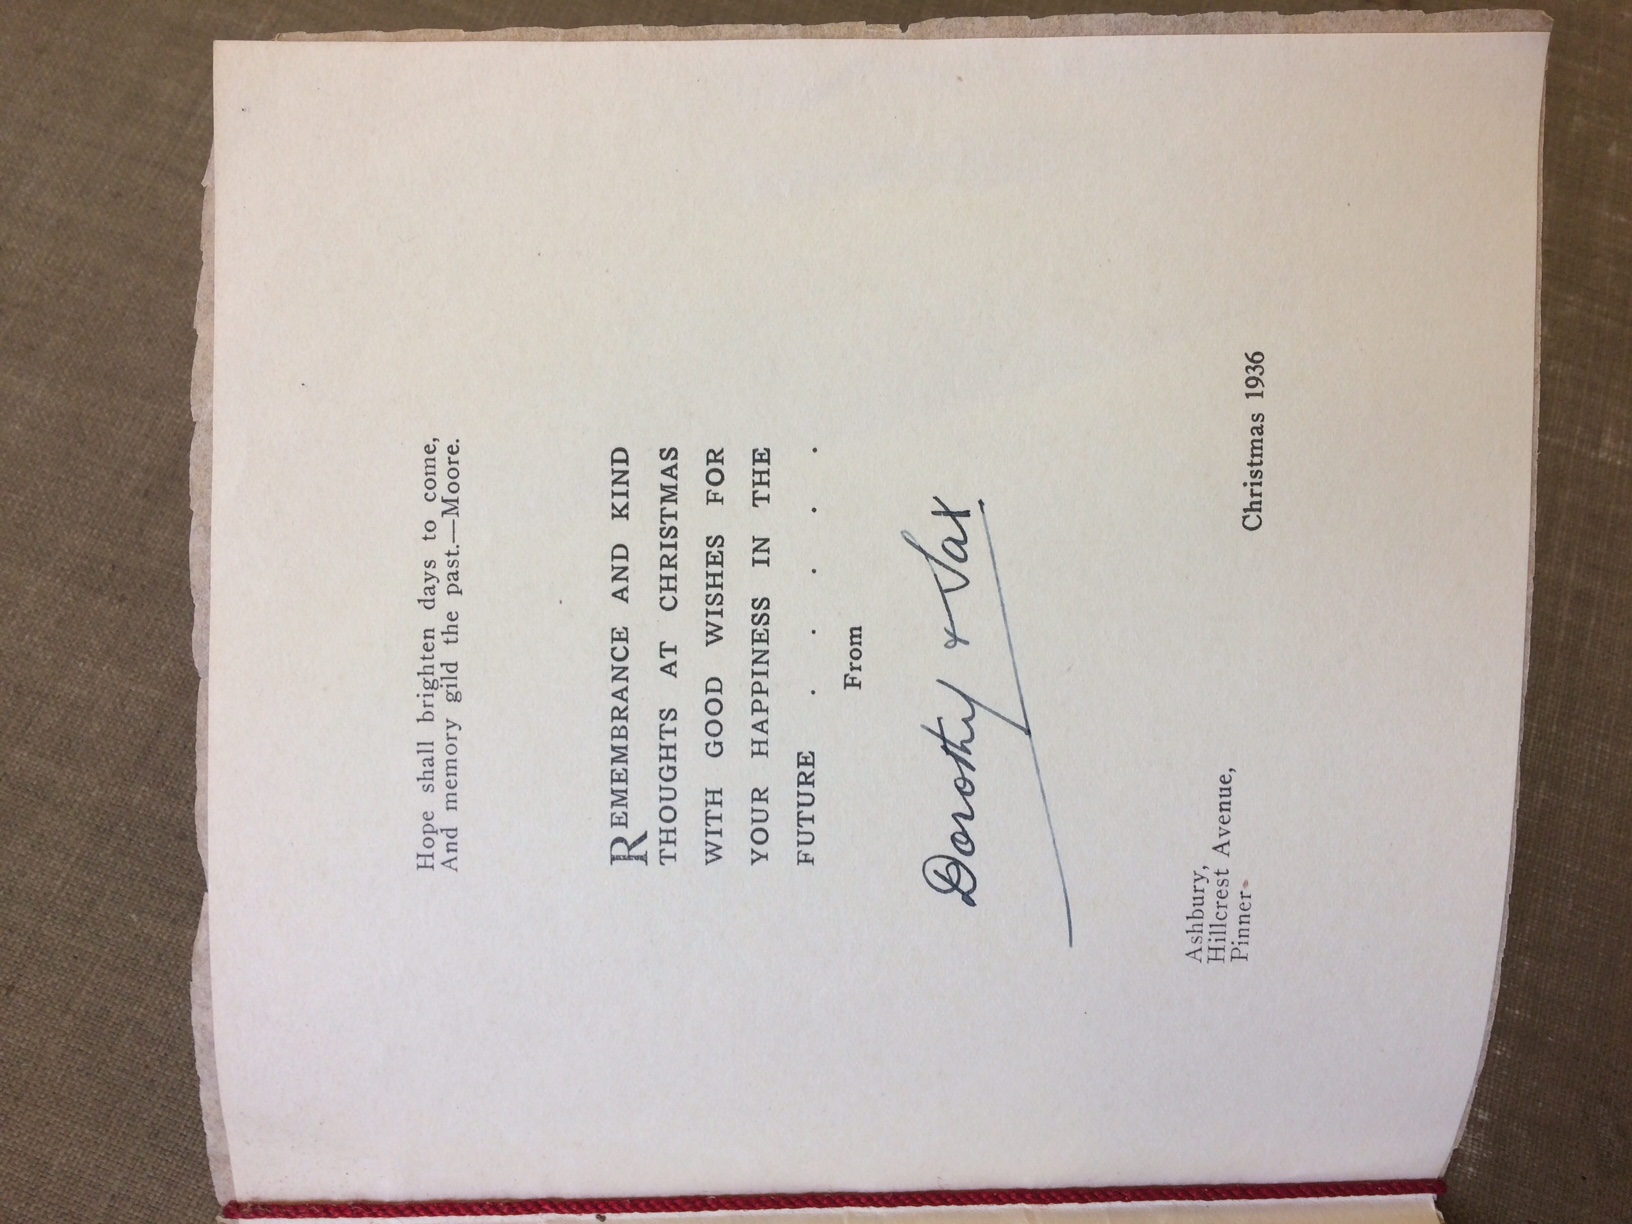
Rummaging through virtual maps

Over the past 4 months, the Map Room staff have, like so many others, been working from home. Away from our physical map collection, what have we been doing?

Cataloguing staff are working on a project to to index a large collection of digital scans. Thousands of our maps have been scanned to provide images for research purposes, but we don’t yet have a complete list to show which scan number corresponds to which map. The scans include a huge variety of different maps. There are loose sheets from the Gough Maps collection covering the British Isles, trench maps from WWI, maps from the Commonwealth and African Collections, early atlases from the Allen collection, and around 3000 maps with an (E) shelfmark – sheet maps dating from before 1850, for places all over the world. The latter include beautiful early printed maps (such as the view of Toledo in Spain by Braun and Hogenberg above) and maps made for practical purposes (the second image is from the report for the Bog Commission in Ireland, published in 1814).

There are a small number of manuscript maps as well, such as this sketch of the Kusasi region in northern Ghana, from the Commonwealth and African Collections. It was made in 1927 and shows the area divided into tribal regions; a published map based on this one was produced in Accra the following year. Its condition suggests that it was very much a working document.

A big positive for those involved has been the opportunity to look at images of these interesting, varied and often beautiful maps from our collections. It’s the virtual equivalent of spending days rummaging through the drawers (which we wouldn’t usually have time to do!) This should be the first step towards adding many of these images to the Digital Bodleian collection.

The bogs on the rivers Laune and Lower Maine in Kerry / by. A. Nimmo. J. Basire sculp. From the 4th report of the Commission on the Bogs in Ireland. London: House of Commons, 1814.  (E) C19 (204)

Toletum. Cologne : Georg Braun, 1593. (E) C38 (167)

Sketch map of the Kusasi District, Gold Coast. Signed by C. St B. Shields, 12.12.27. 722.11 t.1 (25).

The Devil’s what?

Herman Moll (c1654-1732) was a cartographer  who moved to London from north-west Europe in 1678. At first Moll worked for other established mapmakers as an engraver before setting up his own workshop making and selling maps. These images come from one of his most celebrated works, ‘A set of fifty new and correct maps of England and Wales’* published in 1724. The Bodleian has a number of copies of this work, some of which were in black and white with others hand-painted, these images come from one of the black and white editions.

Oxfordshire has two illustrations for Blenheim Palace, completed two years earlier in 1722, and one for the Rolle-Rich Stones (Rollright Stones), built considerably earlier at some point  between 2670 to 1975 BC. For those familiar with the Rollrights this is an image before restoration in the late 1800s which replaced a lot of stones broken up from the original circle, increasing the amount of stones in place. Next to the Rollrights is a mosaic from a Roman villa north of Woodstock.

One of the stranger illustrations found on any of the county maps is from the the West Riding of Yorkshire page, of the Halifax gibbet, which promises ‘according to the Halifax Law whereby they beheaded any one instantly‘. A ruling (the ‘Halifax Law’) that allowed the Lord of the Manor to execute thieves by beheading had been in place since the 1200s, and the gibbet was Installed at some point in the sixteenth century. A large number were executed under this law but it isn’t known how many were executed using the gibbet, which was dismantled after the the last executions in 1650 under instruction from Oliver Cromwell.

Moll had an obvious love of anything old, his county maps are filled with portraits of antiquities around the margins, and on his title page a note promises ‘to render this work more acceptable to the curious, the margins of each map are adorn’d with great varieties of very remarkable antiquities’. Roman coins and fossils, given all sorts of weird and wonderful names, feature prominently. On this half page of Wiltshire two views of Stonehenge are given. Both are a relatively accurate portrayal, something that earlier cartographers such as John Speed, hadn’t done, setting the great circle in mountainous countryside and making the stones look tubular (extract from Wiltshire, John Speed, facsimile (E) C17:61 (49), original map 1610).


.

This last page is a map of the county of Derbyshire, parts of which have an underlying limestone bed, leading to numerous cave systems.

The Devil’s Arse is more commonly known now as Peak Cavern.

There is little in the maps in Moll’s book that make them any more special than similar atlases printed at the time. Few roads are shown, though those that do have distances between towns marked, and boundaries of the county hundreds are set out. What makes Moll special is the illustrations, historical portraits made to appeal to both the armchair traveller and any with an archaeological and scientific interest giving an idea of the unique features found in each of the counties.

*The full title is A set of fifty new and correct maps of the counties of England and Wales, &c. with the great roads and principal cross-roads, &c. Shewing the computed miles from town to town. A work long wanted, and very useful for all gentlemen that travel to any part of England. All, except two, composed and done by Herman Moll, geographer.

Allen 18